Top 5 Countries Leading the Dynamic Pricing Revolution
Dynamic pricing, the practice of adjusting product prices in real time based on demand, competition, inventory, and other market signals, has become one of the defining features of modern eCommerce. Once limited to airline tickets and hotel rooms, algorithmic pricing now touches nearly every product category, from groceries and fashion to electronics and home improvement supplies. Our second-annual Dynamic Pricing Index, compiled from over 1.5M data points tracked at four-hour intervals across more than 120 eCommerce platforms in 40+ countries, reveals the scale and sophistication of this practice.
Benediktas Kazlauskas
Last updated: Feb 19, 2026
8 min read
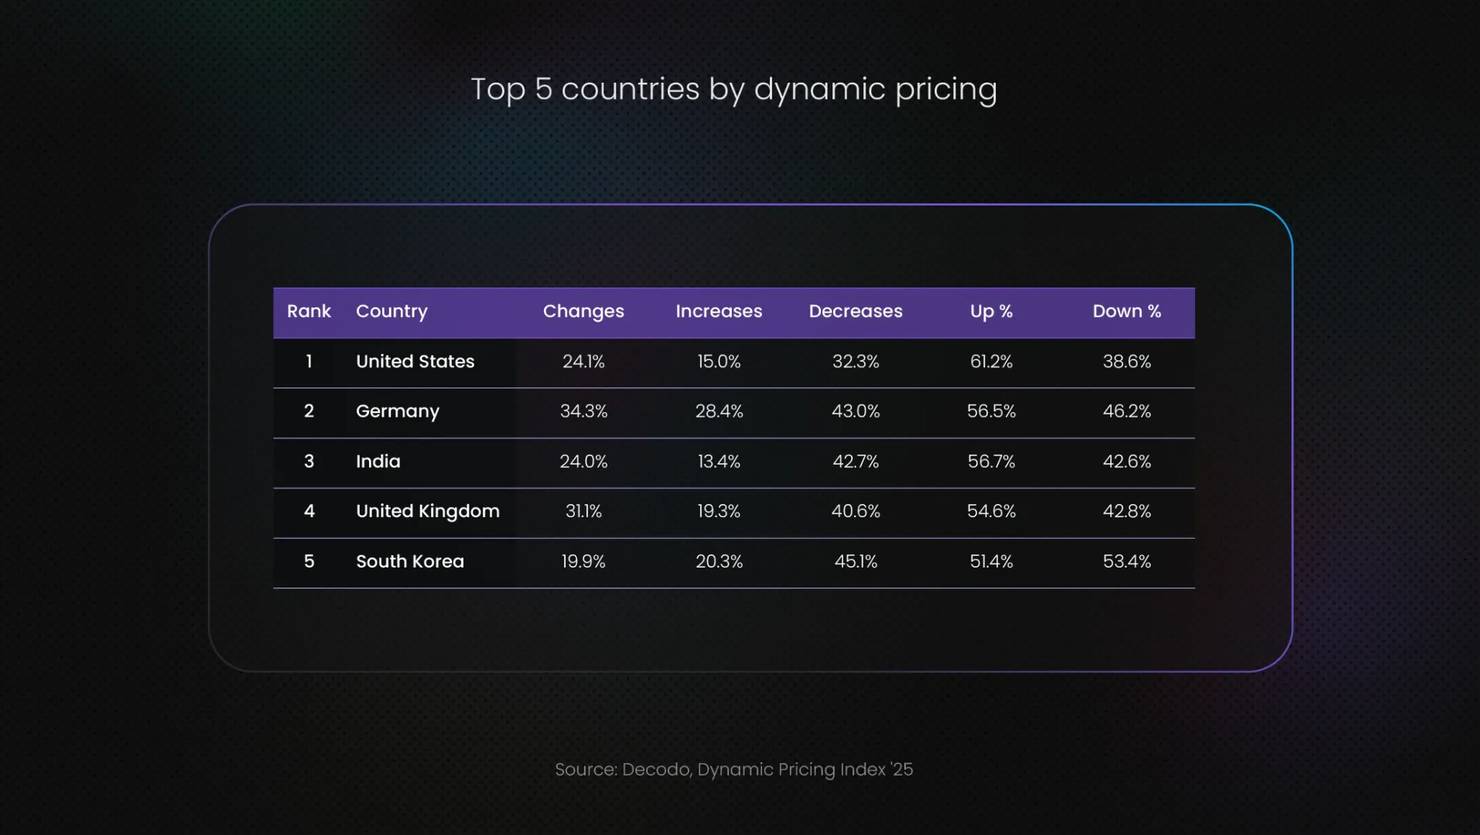
#1. United States (542,946 price changes)
The United States dominates the Dynamic Pricing Index by an extraordinary margin. With 542,946 recorded price changes throughout 2025, the U.S. accounts for more price fluctuations than the next four countries combined. This is a reflection of the sheer scale of American eCommerce, the intensity of competition among retailers, and the advanced algorithmic pricing infrastructure that major platforms have built over the past decade.
What makes the U.S. market particularly interesting is the near-perfect balance between price increases and decreases. According to our research, 50.10% of all changes were upward adjustments, while 49.90% were downward. This tight margin suggests that American retailers are not simply raising or lowering prices. They’re continuously optimizing, testing consumer response, and adjusting in micro-increments to find the ideal price point at any given moment.
The dominance of U.S.-based websites in the top 30 reinforces this picture. Amazon.com alone recorded 116,509 price changes, the highest of any single domain globally, followed by Walmart (68,926), Target (39,386), and Best Buy (30,188). American retailers are also among the most aggressive in deploying deep price drops, with Amazon registering a 100% deep drop rate and a drop depth of 35.30%.
"The U.S. is the testing ground for dynamic pricing at scale," explains Gabriele Vitke, Senior Product Marketing Manager. "American retailers have invested heavily in pricing algorithms, and consumers have come to expect that prices will fluctuate."
North America, as a region, recorded the highest volatility at 55.3%, compared to 48.7% in Asia and 48.7% in Europe. This volatility is driven in large part by the competitive dynamics between Amazon, Walmart, and Target, which together account for the majority of price changes in the region.
#2. Germany (81,554 price changes)
Germany ranks second globally with 81,554 recorded price changes, establishing itself as Europe's undisputed leader in dynamic pricing activity. The German market shows a slight tilt toward price decreases, with 51.70% of changes being downward adjustments and 48.30% being increases. This pattern aligns with broader European trends, where consumer protection awareness and competitive grocery markets create downward pricing pressure.
The German eCommerce landscape is shaped by a unique combination of global platforms and strong domestic players. Lidl.de stands out in the dataset with 35,259 price changes, the sixth-highest of any website globally. Remarkably, Lidl recorded a 91.70% deep drop rate and a drop depth of 77.50%, which is among the highest in the entire index. This suggests that Lidl's dynamic pricing strategy is exceptionally aggressive, using dramatic price reductions as a core competitive tool.
Europe as a whole recorded the highest stability share at 47.2%, meaning that nearly half of all pricing patterns in the region showed consistent, non-volatile behavior. Yet Germany's presence at the top of the rankings shows that stability and dynamism can coexist. German retailers may maintain stable base prices for many products while aggressively adjusting others.
#3. India (54,353 price changes)
India's third-place ranking with 54,353 price changes reflects the country's explosive eCommerce growth and the increasing sophistication of its pricing infrastructure. The Indian market is nearly balanced between increases (49.80%) and decreases (50.20%), with a marginal lean toward downward adjustments that reflects the fiercely competitive landscape between platforms like Flipkart, Amazon India, and a growing number of direct-to-consumer brands.
The Asia region, of which India is a major contributor, recorded the highest drop depth at 20%. This means that when Asian retailers cut prices, they cut them more deeply than their counterparts in Europe (14.4%) or North America (18.3%). For Indian consumers, this translates to significant savings opportunities during flash sales, festival promotions, and marketplace-driven discounting events that have become hallmarks of the Indian eCommerce calendar.
"India's dynamic pricing ecosystem is evolving at an incredible pace," says Gabriele Vitke, Senior Product Marketing Manager. "The combination of a massive, price-sensitive consumer base and increasingly sophisticated tech stacks means that Indian eCommerce is becoming one of the most dynamic markets in the world."
#4. United Kingdom (50,467 price changes)
The United Kingdom recorded 50,467 price changes in 2025, securing the fourth position globally. Like Germany, the UK market leans toward price decreases, with 51.80% of changes being downward and 48.20% upward. This is consistent with the broader European pattern and may reflect the UK's highly competitive grocery and fashion retail landscape, where consumer expectations for promotions and deals remain deeply embedded in shopping culture.
Several UK-based domains appear in the top 30 of the index, including Tesco.com (10,436 changes), Boots.com (10,141 changes), and Sainsbury's (10,023 changes). The presence of three grocery and pharmacy chains in the top 30 underscores how central everyday essentials are to the UK's dynamic pricing activity. Tesco, with a 25% deep drop rate and 21.30% drop depth, takes a more measured approach than Lidl, while Boots shows greater aggressiveness with a 41.70% deep drop rate and 34.80% drop depth.
The UK data also reveals interesting day-of-week patterns. While Monday is the most common day for price changes among many global retailers, UK platforms show more diversity, with Sunday being the best day for deals at Boots and Sephora (which also has a significant UK presence). This suggests that UK retailers may time their price adjustments to capture weekend and early-week shopping traffic.
#5. South Korea (41,933 price changes)
South Korea rounds out the top 5 with 41,933 recorded price changes, confirming its status as one of Asia's most digitally advanced retail markets. The split between increases (49.70%) and decreases (50.30%) is remarkably balanced, mirroring the near-equilibrium seen in the United States. This balance indicates a mature market where retailers are fine-tuning prices constantly rather than relying on large, infrequent adjustments.
South Korea's eCommerce sector is driven by a combination of marketplace giants like Coupang and a tech-savvy consumer base that expects rapid delivery, competitive pricing, and a seamless mobile shopping experience. The country's strong digital infrastructure enables retailers to deploy real-time pricing adjustments with high precision, and Korean consumers are among the most price-comparison-active in the world.
Bottom line
Across all 5 leading countries, price increases and decreases are nearly balanced, showing that retailers have moved into constant, automated optimization rather than relying on periodic markdowns. Regionally, North America leads in volatility (55.3%), Europe in stability (47.2%), and Asia in drop depth (20%), each shaped by local shopping habits and competitive dynamics. Fashion, Electronics, and Groceries together account for over a million price changes, and that pace will only pick up as AI-driven pricing tools reach more retailers.
For shoppers, the takeaway is simple – online prices are always moving. Knowing when and where to buy, a Wednesday on Amazon, a Monday at Walmart, a flash sale in Seoul, can save real money.
About the author

Benediktas Kazlauskas
Content & PR Team Lead
Benediktas is a content professional with over 8 years of experience in B2C, B2B, and SaaS industries. He has worked with startups, marketing agencies, and fast-growing companies, helping brands turn complex topics into clear, useful content.
Connect with Benediktas via LinkedIn.
All information on Decodo Blog is provided on an as is basis and for informational purposes only. We make no representation and disclaim all liability with respect to your use of any information contained on Decodo Blog or any third-party websites that may belinked therein.