What Are The Most Volatile eCommerce Categories?
If you’ve ever added a product to your cart only to find the price has shifted by the time you check out, you’ve experienced dynamic pricing in action. What once seemed like sporadic discounting is now a sophisticated, algorithmically driven discipline that reshapes prices across millions of products every hour of every day.
Benediktas Kazlauskas
Last updated: Feb 19, 2026
8 min read
To quantify exactly how volatile online pricing has become, we analyzed 1.5M+ data points across more than 120 eCommerce platforms spanning 40+ countries throughout 2025. Prices were tracked daily at four-hour intervals, covering over 1,500 products across six major retail categories. The result is the Dynamic Pricing Index, the most granular picture of global pricing behavior available today.
The findings are surprising. Some categories see prices change so frequently that a product’s listed price at 8 AM may bear little resemblance to its price at noon. Others remain remarkably stable for months. Understanding where your industry falls on this spectrum, and why, is essential for any business competing on price.
Category-by-category breakdown
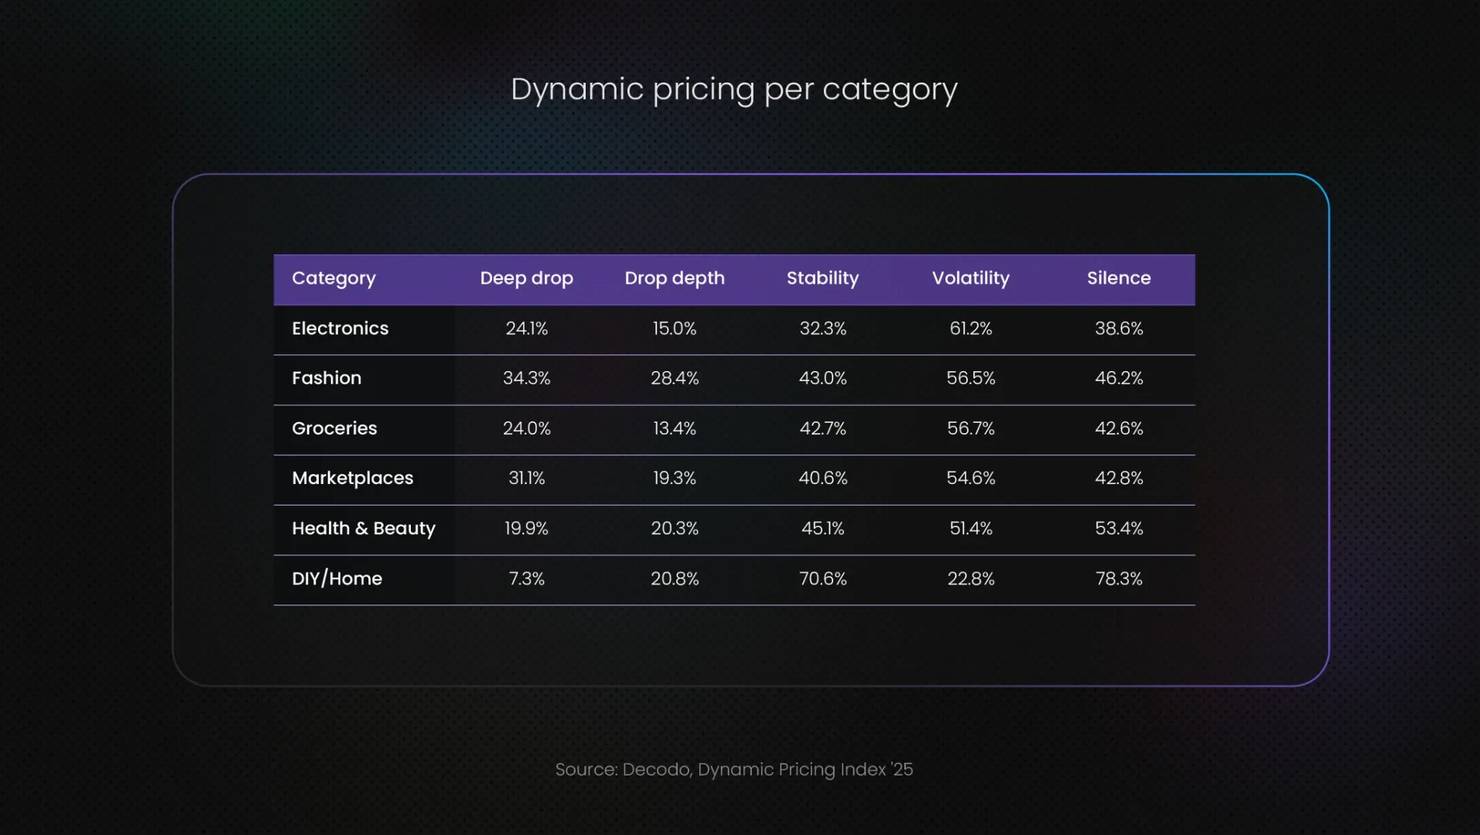
Not all product categories are created equal when it comes to pricing volatility. The data reveals a clear hierarchy, with Electronics and Fashion dominating the volatility charts while DIY/Home products remain comparatively static.
Electronics – the most volatile category
Electronics tops the volatility ranking at 61.2%, meaning that for more than 6 out of every ten measurement periods, prices were changing. The category’s stability share is the second lowest at just 32.3%, and its change silence rate of 38.6% confirms that pricing engines in consumer electronics rarely rest.
Why are electronics so volatile? Several factors play here. Product lifecycles are short, a flagship smartphone announced in January may see its street price decline steadily through the year as newer models enter the pipeline. Retailers like Amazon and Best Buy deploy real-time repricing algorithms that react to competitor listings within minutes. Seasonal demand spikes around events like Prime Day, Black Friday, and back-to-school season create sharp drops followed by rapid recoveries.
Fashion – highest deep drop rate
Fashion ranks second in overall volatility at 56.5%, but it leads all categories in one critical metric: deep drop rate at 34.3%. This means that more than a third of all observed pricing periods involved significant price reductions. Combine this with the highest drop depth of any category at 28.4%, and the picture is clear – fashion retailers don’t just change prices frequently, they slash them aggressively.
The reason is structural. Fashion operates on seasonal collections with hard expiration dates. A winter coat unsold by February is dead inventory. Retailers and ASOS follow this strategy – pricing starts high at launch, then drops rapidly as the season progresses. However, some retailers, like H&M, show an even bigger drop in depth, indicating extremely aggressive markdowns when stock needs to clear.
The total price change volume for fashion across the index was 427,340, the highest of any category. With a nearly even split between increases (49.3%) and decreases (50.7%), fashion pricing is a constant push-and-pull between launching premium and discounting to move volume.
Groceries – surprisingly volatile category
Groceries rank third in volatility at 56.7%, a figure that may surprise consumers who think of food pricing as relatively stable. Yet the data tells a different story – 318,950 total price changes across grocery platforms in 2025, with a perfectly balanced 50/50 split between increases and decreases.
Grocery volatility is driven by perishability, supply chain sensitivity, and intense competition. Kroger registered changes with a 50% deep drop rate, reflecting a strategy of aggressive weekly promotions paired with regular resets. Publix showed frequent changes but with higher stability (25% stability share), consistent with its reputation for everyday-low-price positioning. Lidl, the German discounter, recorded price adjustments with a surprising 77.5% drop depth, indicating dramatic markdowns likely tied to clearance of expiring stock and limited-time promotions.
Marketplaces – algorithmic pricing at scale
Marketplace platforms showed a volatility rate of 54.6% with a 31.1% deep drop rate, the second highest after fashion. With 64,190 total changes, marketplaces like AliExpress and Wish demonstrate what happens when millions of third-party sellers compete algorithmically on the same platform.
The marketplace model inherently produces volatility because pricing is decentralized. Multiple sellers offer the same product, each running their own repricing strategies. The result is a constant churn of price adjustments as sellers undercut each other, respond to Buy Box algorithms, and react to demand signals in real time.
Health & Beauty – moderate volatility with deep discounts
Health & Beauty occupies the middle ground at 51.4% volatility. Its deep drop rate is a modest 19.9%, but its drop depth of 20.3% suggests that when discounts happen, they’re meaningful.
Retailers like Sephora, Boots, and pharmacies like Walgreens and CVS follow a pattern of stable base pricing with event-driven promotions around holidays, seasonal campaigns, and loyalty program activations.
DIY/Home – the stability anchor
At the opposite end of the spectrum, DIY/Home products are the most price-stable category in the index, with a 70.6% stability share and just 22.8% volatility, less than half the rate of electronics. The change in the silence rate of 78.3% means that for the vast majority of measurement intervals, prices simply did not move.
Home Depot exemplifies this approach with quite frequent price changes but a 66.7% stability rate and 75% change silence. Lowe’s follows a similar pattern with 33.3% stability. Menards is the most static of the group at 58.3% stability and 66.7% silence.
The stability makes sense. DIY and home improvement products have long shelf lives, predictable demand, and fewer competitive-repricing triggers than electronics or fashion. When a bag of concrete or a kitchen faucet is priced, it tends to stay priced.
What this means for businesses and consumers
For retailers and brands, the message from this data is clear – if you’re not actively monitoring competitor pricing in real time, you’re flying blind. In categories like electronics and fashion, where volatility exceeds 55%, pricing decisions made on weekly or monthly cycles are effectively outdated before they’re implemented. The retailers winning on price are those with infrastructure to track, analyze, and respond to competitor changes within hours, not days.
For consumers, the data suggests that timing matters more than ever. The best day to shop varies by retailer – Wednesday for Amazon, Monday for Walmart, Saturday for Target and Newegg, Friday for Best Buy. Price tracking tools, data collection solutions like Web Scraping API, and alert systems can capture meaningful savings, especially in categories where drop depths regularly exceed 20%.
Continue exploring Decodo's Dynamic Pricing Index and fresh, data-backed insights that help you make confident purchasing decisions, from spotting real discounts and seasonal price spikes to avoiding overpaying, while businesses can use the same data to track competitor pricing trends, measure category volatility, and uncover smarter margin optimization opportunities.
About the author

Benediktas Kazlauskas
Content & PR Team Lead
Benediktas is a content professional with over 8 years of experience in B2C, B2B, and SaaS industries. He has worked with startups, marketing agencies, and fast-growing companies, helping brands turn complex topics into clear, useful content.
Connect with Benediktas via LinkedIn.
All information on Decodo Blog is provided on an as is basis and for informational purposes only. We make no representation and disclaim all liability with respect to your use of any information contained on Decodo Blog or any third-party websites that may belinked therein.