US vs Asia: How eCommerce Regions Approach Dynamic Pricing
The US and Asia dominate global eCommerce, but their dynamic pricing strategies reveal distinct philosophies. Using 1.5M data points from 120+ platforms, our second-annual Dynamic Pricing Index compares how each region approaches price changes. We analyzed discount depth, pricing volatility, and stability to uncover what these patterns reveal about consumer behavior and competitive strategy.
Gabriele Vitke
Last updated: Feb 19, 2026
8 min read

US dominance in raw numbers
Before comparing strategies, it helps to understand the sheer difference in volume between these 2 regions.
The United States alone recorded 542,946 price changes in 2025, more than all Asian countries in the index combined. India logged 54,353 changes, South Korea 41,933, China 35,456, and Singapore 24,357. Added together, the 4 largest Asian markets in the index total roughly 156,099 price changes, which is less than a third of the US figure.
This gap reflects several factors. The US eCommerce market is more consolidated around a handful of massive platforms, each of which tracks and adjusts prices across millions of SKUs. Amazon alone accounted for 116,509 price changes, which already exceeds any single Asian country’s total. Walmart added another 68,926 changes. These two platforms together drove more pricing activity than the entire Asian dataset.
That said, raw volume alone does not tell the full story. Asia’s lower total reflects a different market structure, not a less dynamic one. Many Asian markets operate through fragmented ecosystems of niche platforms, social commerce apps, and region-specific marketplaces that were outside the scope of this index. AliExpress, the largest Asia-linked platform in the dataset, recorded 46,462 price changes with a 91.70% deep drop rate, signaling that when Asian platforms do reprice, they do it with conviction.
Two different pricing rhythms
The most striking difference between the US and Asia is how they handle the tempo of price changes.
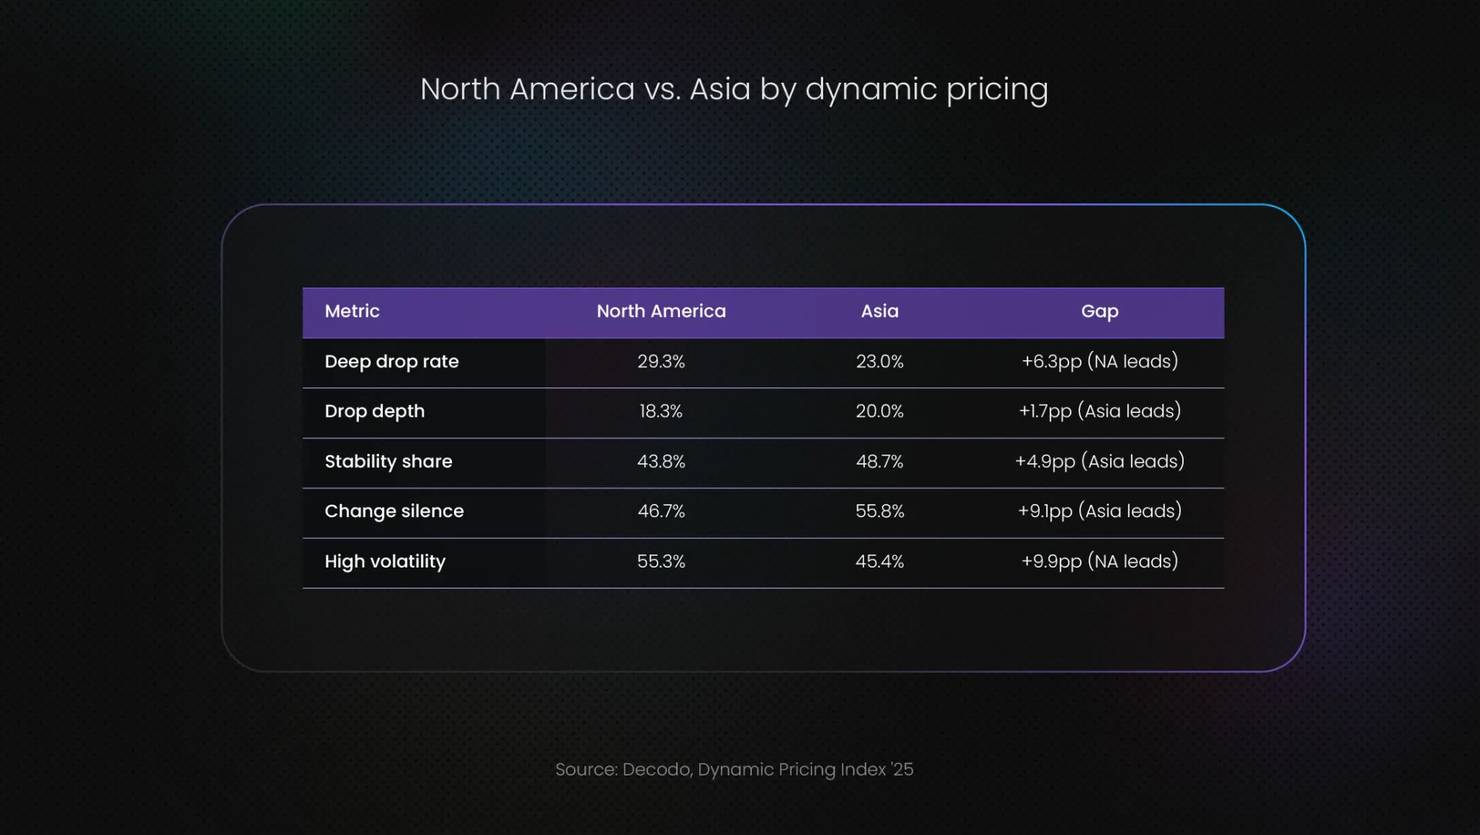
North America recorded the highest volatility of any region at 55.3%, compared to Asia’s 45.4%. This means that more than half of all pricing activity in the US market involved significant swings, where prices moved meaningfully rather than adjusting by small increments. In Asia, fewer than half of all changes qualified as highly volatile.
This difference in volatility has real-world implications. For US consumers, prices on major platforms can shift multiple times in a single day. Amazon’s 0% stability and 0% silence scores confirm that prices on the platform are in constant motion, with no quiet periods and no products sitting at a fixed price for any meaningful duration. Walmart shows slightly more restraint with 8.30% stability and silence, but remains highly dynamic.
Asian markets, on the other hand, tend to hold prices steady for longer periods before making sharper adjustments. Asia’s change silence rate is 55.8%, the highest of any region and nearly 10 percentage points above North America’s 46.7%. This suggests a “hold and strike” approach: Asian retailers keep prices stable to build consumer trust and predictability, then deploy aggressive markdowns during targeted promotional windows.
Deep price adjustments in Asia
One area where Asia clearly outperforms North America is drop depth, the average percentage discount when prices are reduced.
Asia recorded a drop depth of 20%, compared to North America’s 18.3%. While the 1.7 percentage point difference may seem modest, it becomes significant at scale. Across tens of thousands of price changes, a consistently deeper discount pattern means that Asian consumers who time their purchases right are rewarded with steeper savings.
This pattern is driven in part by the promotional culture that defines Asian eCommerce. Events like India’s Diwali sales, China’s Singles’ Day, and South Korea’s Coupang mega-sales create concentrated periods of extreme discounting. Retailers hold prices steady for weeks, then slash them dramatically during a 24-to-72-hour window, creating urgency and driving massive transaction volumes.
In the US, discounting tends to be more continuous. Amazon’s drop depth of 35.30% is among the highest of any platform globally, but this is spread across constant, rolling adjustments rather than concentrated into specific events. The result is that US consumers see a steady stream of moderate deals, while Asian consumers experience fewer but deeper discount events.
Lidl.de offers an interesting contrast point. While technically a European platform, its 77.50% drop depth and 91.70% deep drop rate mirror the Asian “big swing” approach more than the American “constant adjustment” model. This suggests that the deep-discount strategy is not inherently geographic but rather tied to specific retail models and competitive environments.
North America goes big more often
While Asia’s discounts are deeper on average, North America actually triggers deep drops (discounts of 10% or more) more frequently.
North America’s deep drop rate is 29.3%, compared to Asia’s 23%. This means that nearly three out of every ten price changes in North America involve a discount of 10% or more. In Asia, the figure is closer to one in four.
This pattern reflects the competitive dynamics of the US market, where Amazon, Walmart, and Target are locked in a perpetual pricing battle. When one platform drops a price, the others often follow within hours, creating cascading deep drops across multiple retailers for the same product. Amazon’s 100% deep drop rate, meaning every single price change it made qualified as a deep drop, is the most extreme example of this behavior.
In Asia, AliExpress mirrors this pattern with a 91.70% deep drop rate, but other Asian-linked platforms tend to be more selective. The overall lower deep drop rate in Asia aligns with the “hold and strike” model: when prices do change, they change significantly, but the threshold for triggering a change is higher.
Asia’s quiet confidence
2 of the most revealing metrics in the Dynamic Pricing Index are stability share and change silence, both of which favor Asia.
Asia’s stability share is 48.7%, compared to North America’s 43.8%. This means that nearly half of all pricing patterns in Asia showed consistent, unchanged pricing over extended periods. For consumers, this translates to a more predictable shopping experience where the price you see today is likely to be the price tomorrow.
Change in silence tells a similar story. Asia’s 55.8% silence rate means that even when prices do eventually change, there are long stretches of inactivity between adjustments. North America’s 46.7% silence rate indicates a much busier pricing environment where gaps between changes are shorter.
These metrics are especially relevant for retailers considering market entry. A US retailer expanding into South Korea or Singapore would need to adjust its repricing cadence dramatically. Constant small adjustments that work well on Amazon could backfire in a market where consumers expect price stability and respond best to well-timed, significant markdowns.
Target offers an interesting middle ground within the US market. With a 41.70% stability share and 50% silence rate, Target’s pricing behavior actually resembles Asian patterns more than those of Amazon or Walmart. Saturday is Target’s best day for deals, suggesting a more event-driven repricing cadence that contrasts with Amazon’s always-on approach.
Country-level breakdown
Zooming in from regional averages to individual countries reveals additional layers of nuance.
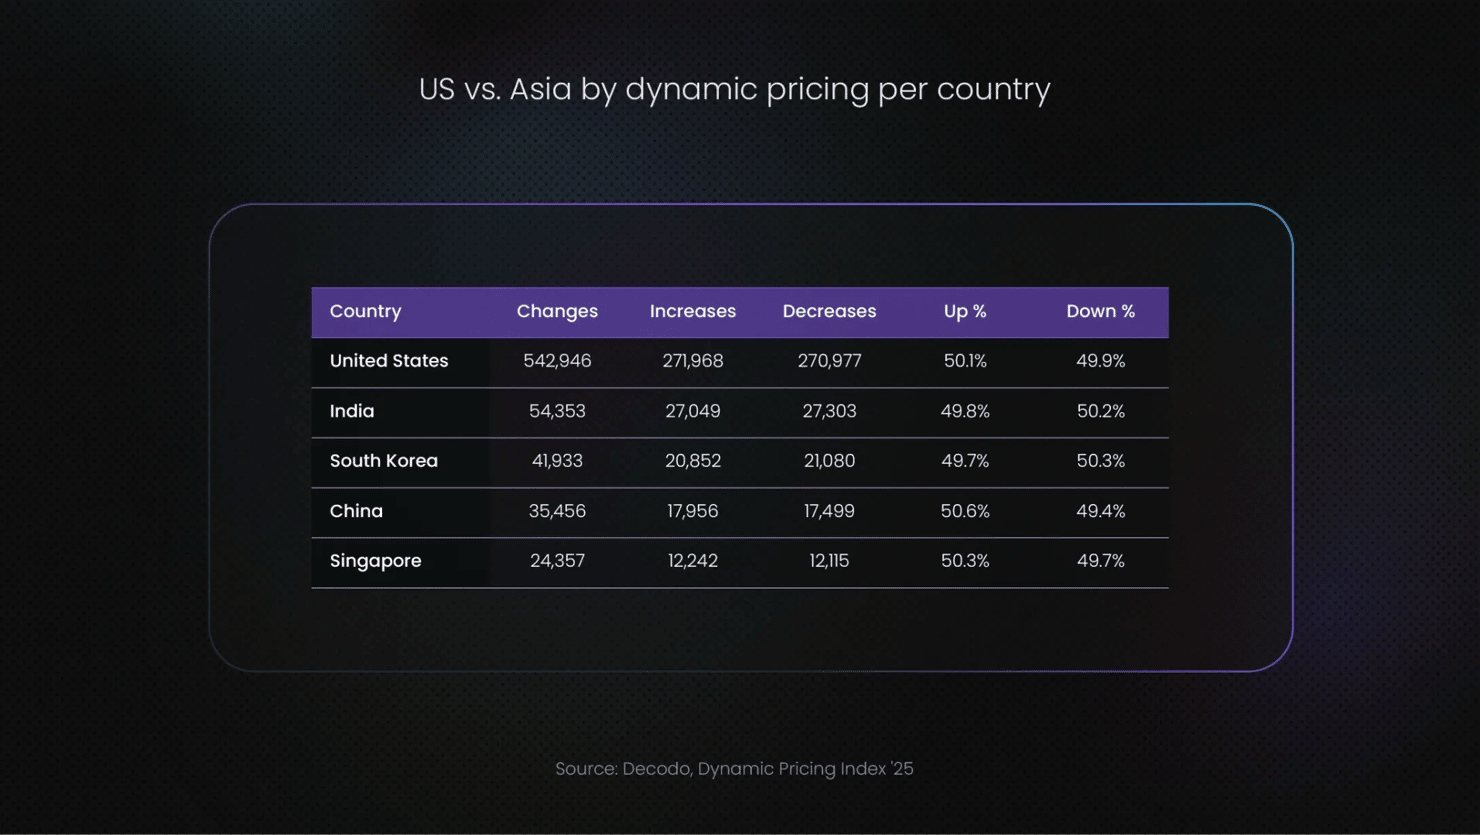
All 5 countries show a remarkably balanced split between price increases and decreases, hovering within 1 percentage point of a 50/50 split. The exception is China, at 50.60% increases vs 49.40% decreases, the most increase-leaning ratio in this group. This could reflect inflationary pressures in specific Chinese product categories, or a strategic preference among Chinese platforms to adjust prices upward more frequently while using event-based sales for dramatic downward corrections.
India and South Korea both lean slightly toward decreases (50.20% and 50.30%, respectively), consistent with price-sensitive consumer bases that respond strongly to discounting. Singapore’s near-perfect balance at 50.30%/49.70% reflects its position as a mature, stable market where pricing adjustments are measured and deliberate.
The US shows the tightest balance of all at 50.10%/49.90%, which is remarkable given the massive volume of changes. With over half a million price adjustments, the fact that increases and decreases are nearly perfectly matched suggests that US algorithms have reached a level of optimization where every price hike is almost immediately offset by a corresponding reduction elsewhere in the product catalog.
What this means for retailers and consumers
The differences between US and Asian pricing behavior have direct implications for anyone operating across these markets.
For retailers expanding from the US into Asia, the data suggests that importing an always-on repricing strategy could be counterproductive. Asian consumers are accustomed to longer periods of price stability punctuated by meaningful discounts. A constant stream of small price changes may erode trust rather than build competitiveness.
For Asian retailers entering the US market, the opposite challenge applies. The US market rewards responsiveness and speed. Platforms like Amazon and Walmart adjust prices thousands of times per day, and consumers have learned to use price-tracking tools to catch the best deals in real time. Holding prices steady for weeks, as might be effective in Seoul or Mumbai, would likely result in lost market share in the US.
For consumers, the takeaway depends on geography:
- US shoppers benefit from monitoring prices continuously, especially mid-week, when Amazon and Walmart tend to make their biggest moves.
- Asian shoppers gain more from waiting for major promotional events, where the deepest discounts are concentrated into a short window.
- Cross-border shoppers on platforms like AliExpress can potentially access both patterns, combining the deep drops of Asian pricing with real-time tracking tools designed for US markets.
Bottom line
The US and Asia represent two fundamentally different approaches to dynamic pricing. The US favors high-frequency, high-volatility adjustments where prices are in constant motion across major platforms. Asia favors longer periods of stability followed by deep, concentrated discounts tied to major sales events. Both models deliver roughly balanced outcomes between increases and decreases, but the rhythm, depth, and consumer experience are distinct.
As pricing algorithms continue to evolve and cross-border eCommerce grows, these regional patterns are likely to influence each other. US retailers may adopt more event-driven strategies for international markets, while Asian platforms may increase their repricing frequency to compete globally. The Dynamic Pricing Index data captures a snapshot of two mature but diverging strategies, and the coming years will show whether they converge or continue to specialize.
About the author

Gabriele Vitke
Product Marketing Team Lead
Gabriele connects strategy, storytelling, and data to help products find their people. With over a decade of experience across SaaS, B2B, and biotech, she’s led rebrands, built go-to-market strategies, and turned complex tech into something clear and genuinely useful.
Connect with Gabrielė via LinkedIn
All information on Decodo Blog is provided on an as is basis and for informational purposes only. We make no representation and disclaim all liability with respect to your use of any information contained on Decodo Blog or any third-party websites that may belinked therein.