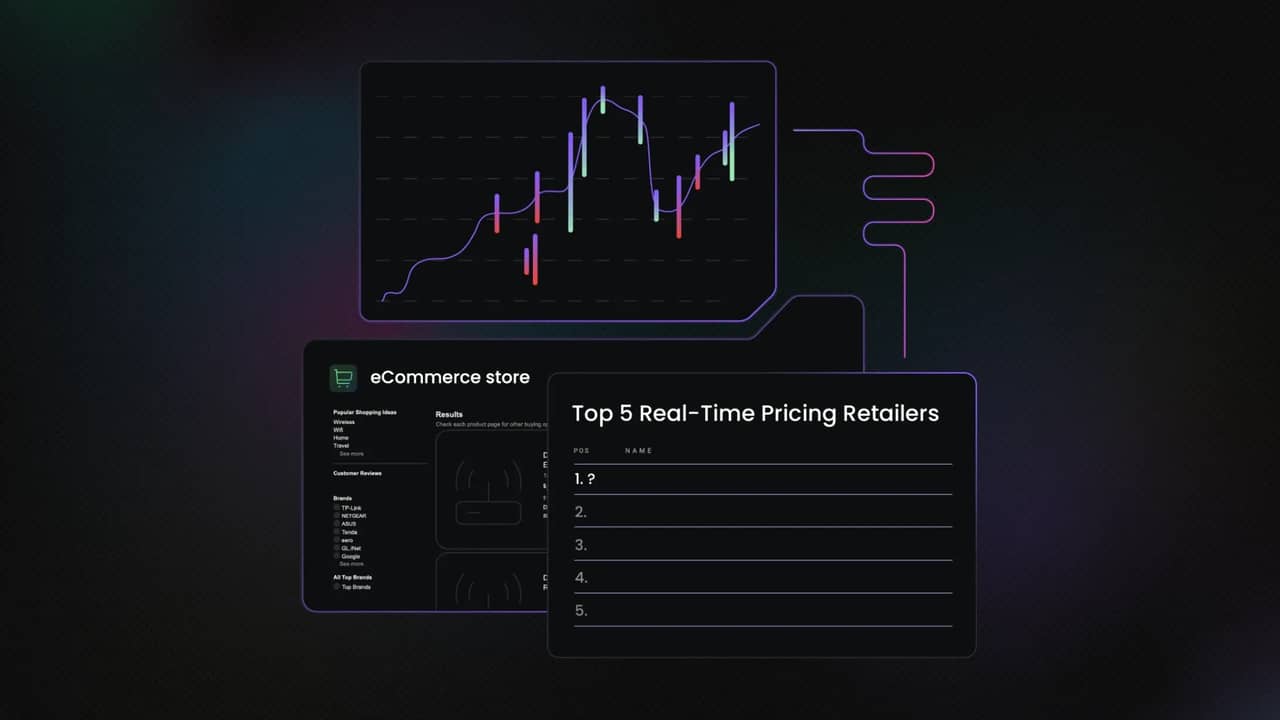
Top 5 Retailers Leveraging Real-Time Pricing
Real-time pricing has moved from a competitive advantage to a competitive necessity. Retailers without algorithmic pricing capabilities now face a structural disadvantage against competitors who can respond to market conditions in minutes rather than days. This report provides the benchmarking data your pricing, merchandising, and technology teams need to assess your competitive position and inform investment decisions.
Our Dynamic Pricing Index report tracked over 1.5M data points across 120 North American, European, and Asian eCommerce platforms. The findings reveal which companies are most aggressively leveraging real-time pricing, and what this means for consumers, journalists, and policymakers.
Gabriele Vitke
Last updated: Feb 19, 2026
8 min read
Retailers leading the real-time price adjustment
Our report highlights that five retailers now set the pace for pricing velocity. Collectively, they execute hundreds of thousands of price adjustments while their competition catches up with dynamic pricing. These are the platforms defining what it means to compete on price in 2026.
#1. Amazon: Maximum Velocity Model
Amazon has redefined what's possible in algorithmic pricing. With a repricing engine deeply integrated into its AWS infrastructure, the e-commerce giant treats every price as provisional, adjusting millions of product prices daily based on competitor actions, demand signals, inventory levels, and customer behavior. Our data confirms Amazon's position as the undisputed leader in pricing velocity, executing 69% more price changes than its nearest competitor.
What makes Amazon's approach unique is its 100% coverage: every single SKU in our tracking experienced significant price fluctuations. For competitors, this creates an asymmetric challenge – price-matching Amazon is effectively impossible without equivalent algorithmic infrastructure and the willingness to embrace continuous repricing as a core operational philosophy.
Strategic positioning
Repricing velocity
Deep discount coverage
Price stability
Price direction balance
Peak repricing day
Market-making through pricing velocity, competitive moat via algorithmic sophistication
116,509 changes (69% more than #2)
100% of SKUs
0%, no static pricing across the catalog
50.2% decreases and 49.8% increases (balanced)
Wednesday, mid-week optimization cycle
With 116,509 price changes and zero price stability, no product in Amazon's catalog keeps a fixed price. The platform's 100% deep discount coverage means every SKU experiences significant price fluctuations, while its nearly balanced direction (50.2% decreases vs. 49.8% increases) suggests algorithmic optimization rather than systematic price inflation. Wednesday emerges as the peak repricing day, indicating a mid-week optimization cycle that competitors should factor into their own pricing strategies.
#2. Walmart: Omnichannel Integration Model
Walmart is making the largest bet on physical retail digitization in U.S. history. Through its partnership with VusionGroup, the retailer is deploying electronic shelf labels across 2,300 stores, with plans to extend to all 4,600 U.S. locations. This infrastructural investment enables something competitors struggle to achieve – true online-offline price parity, with price changes that once took two days now done in minutes.
Unlike Amazon's balanced approach, Walmart's pricing direction tells a consumer-friendly story – 53% of all price movements are decreases. This supports the company's public positioning that dynamic pricing serves customers instead of exploiting them. It’s a narrative that may prove strategically valuable as regulatory scrutiny intensifies across the industry.
Strategic positioning
Repricing velocity
Deep discount coverage
Price stability
Price direction balance
Peak repricing day
Price leadership through scale, ESL infrastructure enabling online-offline price parity
68,926 changes
66.7% of SKUs
8.3% of the catalog unchanged
53% decreases with 47% increases (consumer-favorable)
Monday, the weekly promotional cycle start
Walmart's 68,926 price changes position it as the second most active repricing platform, though its strategy differs drastically from Amazon's. The 53% downward price direction, the most consumer-favorable ratio among the top 5, aligns with Walmart's "everyday low price" brand promise. The company's ESL infrastructure investment has reduced price change cycles from two days to minutes, a 99%+ efficiency gain. Monday is Walmart's peak repricing day, suggesting a weekly promotional reset that kicks off each shopping week.
#3. Kroger: Data-Driven Grocery Model
Kroger pioneered real-time pricing in the grocery sector and is now navigating the regulatory consequences. Since launching its EDGE (Enhanced Display for Grocery Environment) shelf technology in 2018 through a Microsoft partnership, the nation's largest supermarket operator has deployed the system across 500+ stores, establishing itself as the grocery industry's most aggressive adopter of dynamic pricing technology.
However, Kroger's data profile raises questions among regulators. With a slight upward pricing bias (50.8% increases vs. 49.2% decreases) and the company's exploration of facial recognition integration, Kroger faces Congressional scrutiny that other retailers should watch closely. The inquiry by Senators Warren and Casey foreshadow compliance requirements that may eventually apply industry-wide.
Strategic positioning
Repricing velocity
Deep discount coverage
Price stability
Price direction balance
Peak repricing day
Grocery-sector pioneer, integrating pricing with a customer data platform
55,601 changes, grocery sector leader
50% of SKUs
0%, no static pricing across the catalog
49.2% decreases and 50.8% increases (slight upward bias)
Monday, the weekly promotional cycle start
Kroger leads the grocery sector with 55,601 price changes, demonstrating aggressive adoption of dynamic pricing in a traditionally stable retail category. The 50% deep discount coverage shows selective discounting rather than Amazon's universal approach, while the slight upward pricing bias (50.8% increases vs. 49.2% decreases) distinguishes Kroger from Walmart's consumer-favorable profile. With 500+ stores now running EDGE Shelf technology and Monday as the peak repricing day, Kroger has established the operational infrastructure for grocery-sector price leadership. And in this position, it has attracted Congressional scrutiny that the industry should monitor closely.
#4. AliExpress: Global Marketplace Model
AliExpress represents the globalization of pricing competition. The Alibaba-owned marketplace demonstrates that U.S. retailers no longer compete solely against domestic rivals – they now face platforms with fundamentally different cost structures, regulatory environments, and pricing philosophies. With a 91.7% deep discount rate (second only to Amazon) and 0% price stability, AliExpress brings aggressive cross-border pricing velocity directly to American consumers.
The platform's inclusion in the top 5 signals a structural shift in competitive dynamics. AliExpress's flash sale model and time-limited deals create constant price volatility designed to drive engagement and urgency. For U.S. retailers competing in overlapping categories, matching this pricing agility may become essential for maintaining market share.
Strategic positioning
Repricing velocity
Deep discount coverage
Price stability
Price direction balance
Peak repricing day
Cross-border eCommerce, flash sale, and time-limited deal model
46,462 changes
91.7% of SKUs
0%, no static pricing across the catalog
47.3% decreases and 52.7% increases (slight upward bias)
Monday, the weekly promotional cycle start
AliExpress recorded 46,462 price changes with a 91.7% deep discount rate, second only to Amazon, demonstrating the aggressive cross-border pricing velocity that Chinese eCommerce platforms bring to global markets. Like Amazon, AliExpress maintains 0% price stability, meaning every tracked product experienced price fluctuations during our study period. The slight upward bias (52.7% increases vs. 47.3% decreases), combined with Monday peak repricing, suggests a weekly flash-sale cycle designed to create urgency and drive engagement across international markets.
#5. Target: Selective Deployment Model
Target proves that dynamic pricing infrastructure doesn't require constant repricing. While competitors race toward maximum pricing velocity, Target has charted a different course that prioritizes brand consistency and "everyday value" positioning over algorithmic aggressiveness. With 41.7% price stability (more than five times higher than Amazon or AliExpress) and 50% of its catalog completely unchanged during our study period, Target demonstrates strategic restraint.
What's particularly distinctive is Target's promotional timing: Saturday emerges as the peak repricing day, making it the only top-5 retailer focused on weekend shoppers rather than the Monday/Wednesday cycles favored by competitors. This approach suggests Target is optimizing for in-store weekend traffic rather than continuous online price competition – a fundamentally different strategic bet that may resonate with retailers prioritizing customer experience over pricing warfare.
Strategic positioning
Repricing velocity
Deep discount coverage
Price stability
Price direction balance
Peak repricing day
"Everyday value" brand positioning, selective dynamic pricing deployment
39,386 changes
16.7% of SKUs, the lowest in the top 5
41.7%, the highest in the top 5, over 5 times higher than Amazon or AliExpress
53.5% decreases and 46.5% increases (consumer-favorable)
Saturday, a unique weekend focus
Target's 39,386 price changes represent the most restrained approach among the top 5, with 41.7% price stability, over 5 times higher than Amazon or AliExpress. The 16.7% deep discount coverage (lowest in the ranking) and 50% price stability rate indicate deliberate selectivity rather than universal repricing. Most distinctively, Target is the only top-5 retailer where Saturday emerges as the peak repricing day, suggesting optimization for weekend in-store traffic rather than continuous online competition. This measured approach preserves Target's "everyday value" brand positioning while maintaining competitive response capability.
Bottom Line
Real-time pricing has become universal, but its deployment remains highly differentiated. Amazon treats every price as temporary, Target keeps half its catalog untouched, Walmart leans into consumer-friendly decreases, Kroger edges toward margin optimization, and AliExpress brings Chinese eCommerce velocity to a range of doorsteps.
The competitive effects are clear. With Amazon executing 69% more price changes than its nearest rival and maintaining 100% discount coverage across its catalog, the benchmark for pricing infrastructure has been permanently raised. Yet Target's success with selective deployment proves that maximum velocity isn't the only way forward.
Explore the Dynamic Pricing Index to uncover real-time pricing velocity, discount depth, stability rates, and repricing patterns across leading eCommerce players.
About the author

Gabriele Vitke
Product Marketing Team Lead
Gabriele connects strategy, storytelling, and data to help products find their people. With over a decade of experience across SaaS, B2B, and biotech, she’s led rebrands, built go-to-market strategies, and turned complex tech into something clear and genuinely useful.
Connect with Gabrielė via LinkedIn
All information on Decodo Blog is provided on an as is basis and for informational purposes only. We make no representation and disclaim all liability with respect to your use of any information contained on Decodo Blog or any third-party websites that may belinked therein.