500 Internal Server Error: Causes, Fixes, and How to Prevent It
A 500 Internal Server Error means the server encountered a generic internal error while processing your request. It's frustrating because the message is deliberately vague. This guide is for you if you run a website, build or maintain applications, or send programmatic requests, whether you are fixing your own site or dealing with 500s from external targets while collecting data from the web.
Justinas Tamasevicius
Last updated: May 05, 2026
9 min read
TL;DR
- A 500 Internal Server Error means the server failed while handling your request
- In most cases, it's a server-side issue, not something you caused
- Common causes include broken code, bad configuration, database failures, plugin conflicts, and resource limits
- The fastest way to fix it is to check logs, review recent changes, and isolate the failing part
- To prevent repeat errors, you need better monitoring, testing, and error handling
What is a 500 internal server error?
A 500 Internal Server Error is an HTTP status code that means the server encountered an unexpected condition and could not complete your request. In plain terms, your request reached the server, the server understood it, and then something failed before it could return a normal response.
To make sense of that, it helps to place it inside the HTTP status code family. 1XX codes are informational, 2XX codes mean success, 3XX codes handle redirection, 4XX codes point to client-side problems, and 5XX codes mean the failure happened on the server side. A 500 sits in that last group, so the issue is with the server’s attempt to handle your request, not with the request format itself. If you want a quick refresher on the underlying terms, start with HTTP requests and responses.
What makes a 500 different from more specific errors is that it's a catch-all response. The server knows something is wrong, but it can't provide a more precise status code to describe the failure. That's why the message often feels unhelpful: the failure is real, but the label is broad.
It also helps to separate a 500 from something like 404 Not Found. A 404 means the server couldn't find the resource you requested. A 500 indicates the resource may exist, but the server failed internally while processing your request. That difference matters because it changes where you look first. A 404 usually points to a URL issue, routing issue, or missing content. A 500 usually points you toward logs, code, configuration, or dependencies.
Common variations of the 500 error message
You will not always see the exact words 500 Internal Server Error. Different servers, frameworks, and platforms present the same underlying failure in different ways, which is why the error can look inconsistent even when the status code points to the same general problem. Microsoft’s IIS documentation and MDN both describe 500 as a generic server-side failure, but the text shown to you depends on the server and the page template in front of it.
The most common variations are:
- 500 Internal Server Error
- HTTP 500
- HTTP Error 500
- Internal Server Error
In browsers such as Chrome, Firefox, and Safari, you will often see either the site’s own error page or a plain browser-rendered page with one of those labels. The wording may change, but the main signal remains the same: the server failed while handling your request.
If the site is running on IIS, the message can get more specific through sub-status codes. These are especially useful because they narrow down the type of server-side failure that occurred. Microsoft documents several of them, including:
- 500.0 – A module or ISAPI error occurred
- 500.11 –The application is shutting down on the web server
- 500.19 – Configuration data is invalid
- 500.21 – The module is not recognized
Those extra digits matter. A plain 500 tells you something failed internally. A sub-code such as 500.19 immediately points you toward configuration problems, rather than leaving you to guess.
You may also run into custom-branded 500 pages. Large platforms sometimes replace the generic server message with a styled page that fits their brand, while still returning a 500 response underneath. In some Google services, for example, the message may appear as Temporary Error (500) instead of the full default phrase.
If you work with WordPress, another common version is the so-called white screen of death. Instead of a visible server error page, the site may render a blank white page when a fatal PHP error or similar internal failure occurs. In practice, that's often still a 500-type problem, just with no useful output shown in the browser.
The main takeaway is that the wording around a 500 can vary a lot, but the troubleshooting direction doesn't. Once you recognize that these different presentations all point to an internal server-side failure, the next step is to separate a true 500 from other 5XX errors that look similar but mean something different.
500 vs. other 5XX HTTP status codes
It's easy to treat every 5XX error as essentially the same, but they don't point to the same kind of failure. If you can tell the difference between 500, 501, 502, 503, and 504, you can usually narrow the problem down much faster.
- A 500 Internal Server Error is the most general one in the group. It tells you the server failed internally, but doesn't explain exactly why. That usually means the server hit an unexpected condition and could not return a more specific error. If you see a 500, you normally start by checking application code, logs, configuration, plugins, database connections, or resource limits.
- A 501 Not Implemented means the server doesn't support the functionality required to fulfill the request. This is less about a crash and more about capability. You’re more likely to see it when the server doesn't recognize or support the HTTP method or feature being requested. In other words, the server is reachable, but it doesn't know how to do what you asked.
- A 502 Bad Gateway points to a different part of the stack. It usually means a proxy, gateway, or load balancer received an invalid response from the upstream server it depends on. If you see a 502, the problem is often not the front-facing server itself, but the service sitting behind it.
- A 503 Service Unavailable usually means the server is temporarily unable to handle the request. That can happen during maintenance windows, traffic spikes, overloaded infrastructure, or short-lived outages. Unlike a 500, a 503 often suggests the problem may clear up on its own once the service recovers. If you work with restricted or blocked targets, it also helps to look at errors like 1005 and 1009, since not every failed request is actually a generic server failure.
- A 504 Gateway Timeout also involves a proxy or gateway, but the difference from 502 is timing. A 504 means the gateway did not receive a response from the upstream server in time. So while a 502 suggests an invalid upstream response, a 504 suggests no timely upstream response at all.
The easiest way to think about these is by location. A 500 usually indicates a server’s internal failure. A 501 points to missing support for the requested functionality. A 502 or 504 indicates trouble between a gateway and an upstream service. A 503 points to a server that's temporarily overloaded, unavailable, or under maintenance.
That difference shapes the whole diagnosis. If you treat these errors as the same thing, you end up checking the wrong layer first. If you separate them properly, the 500 starts to look a lot less mysterious.
What causes 500 internal server errors?
When you start tracing a 500 Internal Server Error back to its source, the possible causes usually fall into a few clear groups: application errors, server configuration issues, resource limits, database failures, third-party conflicts, and infrastructure problems.
Code and syntax errors
Application-level failures are one of the most common causes in PHP and often result in fatal errors, syntax mistakes, or code that breaks after a PHP version change. In Python and Django, unhandled exceptions can result in a 500 error if not caught properly. In Node.js, process crashes, uncaught exceptions, and unhandled promise rejections can do the same. Even a typo in a config file can be enough to break the request path. If your stack includes Python, it helps to understand common Python errors and exceptions.
Server configuration issues
Configuration mistakes are another major cause. On Apache, a corrupted or misconfigured .htaccess file is a classic trigger. On Nginx, an invalid directive in nginx.conf can cause the same type of failure. File permissions also matter. In many setups, files should be 644 and directories 755. PHP version incompatibility belongs here, too. A site that worked before an update can start returning 500s if plugins, themes, or legacy code are no longer compatible. If you work in PHP, it's also useful to understand how PHP environments behave in practice, especially in setup-heavy workflows such as web scraping.
Resource limitations
Some 500s are caused by the environment rather than the code. A PHP process can hit its memory limit. A server can run out of disk space. Too many concurrent processes or connections can pile up at once. CPU and memory spikes during traffic surges can also push an otherwise healthy application into failure. In these cases, the request breaks because the server can't keep up, not because the logic is necessarily wrong.
Database problems
Database failures are another common source. If the application can't connect because the credentials are incorrect or the database server is down, the request can return a 500. Corrupted tables can do the same. Slow or hung queries can also trigger timeouts that surface as internal server errors, especially in applications where every page depends on several database calls.
Third-party dependencies
Third-party components widen the risk. In WordPress, faulty plugins and themes are often high on the suspect list. Conflicts between plugins can break pages that used to work. Outside WordPress, external APIs can also cause cascading failures. If your application depends on a payment gateway, an auth provider, an analytics service, or an external data source, a single upstream failure can result in a 500 error if you don't handle it gracefully. That same pattern shows up in parser-heavy code, too, so if you work in Python, it helps to know what to do when you get parsing errors in Python.
Hosting and infrastructure problems
Sometimes the application is fine, and the problem sits lower in the stack. Shared hosting plans can hit resource limits faster than expected. Firewall rules or tools like ModSecurity can block certain requests, which may surface as 500 errors. Under heavy pressure, traffic spikes or DDoS attacks can overwhelm the server, causing requests to fail across the site.
The key point is that a 500 doesn't tell you which layer failed. It only tells you that the server could not complete the request. That's why logs, recent changes, and context matter more than guesswork.
Impact of 500 errors on your website
A 500 error may appear as a single failed page load, but its effects usually spread further than that. It can interrupt user actions, weaken search visibility, and create knock-on problems for revenue, support, and integrations.
For users
- Visitors can’t load content, complete purchases, submit forms, or use the service normally
- Trust drops quickly, especially when the error appears on login, checkout, or booking pages
- Bounce rates rise because most people leave rather than retry
For SEO
- Search engines cannot reliably crawl or index pages that return 500 errors
- Repeated failures can reduce crawl activity over time
- Rankings can slip if the affected pages matter to search traffic
For the business
- Downtime can turn directly into lost sales, missed leads, or failed signups
- Support tickets increase because users report the issue instead of completing the action
- Reliability starts to look like a brand problem, not just a technical one
For APIs, partners, and scrapers
- API consumers and automated systems fail when your endpoints return 500s
- Integrations and partner workflows can break
- Data pipelines may stop entirely, creating downstream failures beyond the original error
That is what makes 500 errors worth taking seriously. Even when the message looks generic, the impact usually isn’t.
How to diagnose 500 internal server errors
The browser only shows you the symptom. The real cause is usually sitting in logs, debug output, or the request trail behind the page. That's why the best way to diagnose a 500 is to stop guessing and start collecting evidence from the server, the application, and the request itself.
Check the error logs first
If you’ve got server access, logs are usually the fastest way to move from a vague 500 to a specific failure.
Common places to check include:
- Apache: /var/log/apache2/error.log on Ubuntu-based setups, though the exact location can be changed with the ErrorLog directive.
- Nginx: often /var/log/nginx/error.log on Linux systems, but the path depends on the installation and the error_log directive.
- PHP: whatever file is configured as error_log in php.ini, which varies by environment.
If you want to watch errors appear while you reproduce the issue, follow the log in real time:
That's often the quickest way to connect a failed page load to the exact warning, exception, or config error that triggered it.
Turn on debugging carefully
A 500 page may hide details from the browser, but your application can still be configured to log or reveal the real error more safely.
For WordPress, enable WP_DEBUG and WP_DEBUG_LOG in wp-config.php. WordPress documents this as the built-in way to log PHP notices, warnings, and errors, and recommends logging them to wp-content/debug.log.
For Django, DEBUG = True exposes more useful error information during development, but it should not be left on in production. Django’s settings docs make clear that DEBUG changes how exceptions and 500 responses are handled.
For PHP applications outside WordPress, settings like display_errors and error_reporting help surface runtime failures during debugging. For Node.js, a development environment, proper logging, and explicit error handling make the real cause much easier to see than a generic 500 page.
The key point is to use debug mode to reveal the actual exception, not to leave verbose errors exposed to real users.
Use your browser’s developer tools
You don't need server access to learn something useful from a 500.
Open the browser’s Network tab and reload the page. That lets you confirm the actual status code, inspect the failing request, and check whether the response body includes a stack trace, framework error message, or backend hint that the rendered page is hiding. You can also inspect response headers for clues about the server or platform involved.
If you’re debugging requests that rely on browser behavior, script execution, or hidden network calls, it also helps to understand what a headless browser is, since many production issues only become visible when you look more closely at the request flow.
Check hosting or cloud logs
If you don't manage the server directly, the logs may be available through your hosting panel instead.
In cPanel and Plesk, error logs are often exposed through the dashboard. On cloud platforms, the same role is usually handled by platform logging tools such as AWS CloudWatch or Google Cloud Logging. The important part is not the interface. It's getting hold of the raw error message behind the 500.
Test in isolation
Once you’ve got a clue, strip the application down until the failure stops.
That often means:
- Disabling plugins one by one
- Switching to a default theme
- Rolling back a recent deployment
- Replacing a failing route with the smallest possible test case
- Checking whether the error still happens with minimal code
This matters because a single broken piece within a larger stack often causes a 500. Isolation helps you stop treating the entire application as a single black box.
A good diagnosis usually gives you one of two things: a specific message in the logs, or a much smaller set of suspects than you started with. That's enough to move from “something is broken” to an actual fix.
Step-by-step fixes for 500 internal server errors
Once you’ve got a confirmation that the error is real and not just a one-off glitch, work through the fixes in order, start with the lowest-risk checks first, then move into changes that affect application files, server config, or the database.
#1. Reload the page and rule out a local browser issue
Start with the obvious checks:
- Reload the page
- Clear browser cache and cookies
- Test in a private or incognito window
- Try another browser or device
A real 500 is server-side, but this still helps rule out stale cached responses, broken cookies, or browser-specific noise before you start changing server files.
#2. Check whether the site is down for everyone
Before touching the server, confirm whether the failure is global or local.
- If the site is failing for everyone, the issue is likely on the server or hosting side
- If it only fails for you, the problem may be related to your network, IP address, firewall, or session
#3. Review recent changes first
A lot of 500 errors begin right after something changed.
Check whether you recently:
- Updated a plugin or theme
- Deployed new code
- Edited a config file
- Changed PHP or dependency versions
- Modified environment variables or credentials
If the error started immediately after a change, rolling that change back is often faster than debugging a broken state in place. Restoring a recent backup is also reasonable if you know the problem was introduced recently.
#4. Check and fix the .htaccess file on Apache
This only applies if the site is running on Apache.
Start by testing whether .htaccess is the problem:
- Rename .htaccess temporarily
- Reload the site
- If the error disappears, compare the file against known-good rules
- In WordPress, regenerate it by saving permalinks or restoring the default rewrite rules
A safe first test looks like this:
Then reload the site.
If the error disappears, the problem is likely inside .htaccess. At that point, compare the file against known-good rules for your application. On the WordPress official Apache page, the standard rewrite rules for permalinks are listed.
#5. Increase the PHP memory limit
If the application is hitting a memory ceiling during the request, the server may return a 500 instead of a useful page.
In WordPress, one common approach is:
You can also raise the PHP memory limit in php.ini:
Or, if PHP is running as an Apache module and your server allows overrides, you can sometimes set it in .htaccess:
That last option is not universal. PHP’s docs make clear that changing settings in .htaccess applies when PHP runs as an Apache module, and the relevant override permissions are allowed. php.ini is also only read when PHP starts up for server module versions, so that service restarts may be needed after changes.
#6. Deactivate plugins and themes
If you’re troubleshooting WordPress, plugin, and theme conflicts should be high on the list. WordPress’s own troubleshooting docs recommend deactivating all plugins, then reactivating them one by one to find the one causing the issue. If you can't access the admin area, WordPress documentation points you to manual deactivation methods through FTP, phpMyAdmin, or the file manager.
A common file manager or FTP method is to rename the plugins directory temporarily:
If the site loads after that, rename the folder back and reactivate plugins one at a time until the failure returns. Then switch to a default theme and test again if needed.
#7. Check file permissions
File permissions control who can read, write, or execute files on the server. If those permissions are too restrictive, the server may not be able to load the required files, which can trigger a 500 error. If they’re too loose, you may create a security problem while trying to fix a runtime one.
For most PHP and WordPress setups, a good baseline is:
- Files: 644 or 640
- Directories: 755 or 750
In simple terms, that usually means the server can read the files and enter the directories it needs, while other users on the system don't get unnecessary write access. WordPress’s file-permissions documentation recommends 644 for files such as .htaccess, and 755 for directories in shared hosting environments.
If you’re not sure whether permissions are the problem, focus on restoring the normal baseline instead of experimenting with broad write access. Making everything writable may appear to fix the error temporarily, but it's neither safe nor a long-term solution.
#8. Verify the database connection
If the application can't connect to the database, a 500 error is common.
Check:
- Database host
- Database name
- Username and password
- Whether the database service is running
- Whether any recent schema or table changes broke queries
For MySQL, a quick check looks like this:
MySQL’s own docs describe mysqladmin as a client for administrative operations, including checking server status.
If the database is up but requests still fail, look for corrupted tables, connection errors in the logs, or queries timing out under load.
#9. Reinstall core files
If core files are corrupted or partially overwritten, reinstalling them can be faster than manually chasing file-level corruption.
For WordPress, the official update docs describe replacing the core wp-admin and wp-includes directories with fresh copies from the latest download. That's the safest core-repair path because it refreshes the system files without touching your content directory.
So the safe rule here is:
- Replace core files from a fresh official package
- Don't overwrite wp-content
- Keep wp-config.php intact unless you know it's part of the problem
This step is especially useful after a failed update or suspected file corruption.
#10. Contact hosting support with evidence
If none of the earlier steps fix the issue, the problem may sit below the application layer. At that point, it could be tied to exhausted hosting resources, server-level misconfiguration, storage problems, firewall rules, or other infrastructure issues you can't inspect directly.
When you contact support, don't just say the site is broken. Send the exact error, when it started, any relevant log messages, what changed before the issue appeared, and the steps you have already tried. That gives support a much clearer starting point and reduces unnecessary back-and-forth.
If the issue turns out not to be server-wide, the answer often depends on the platform or framework you are running, which is why the next fixes are more specific to WordPress, PHP, Django, and Node.js.
This sequence works because it moves from quick checks to increasingly invasive fixes. If the error is still unresolved after these steps, the problem is usually platform-specific, and framework-level fixes become more important.
Fixing 500 errors on specific platforms
A generic 500-page doesn't tell you much on its own. What you check next depends heavily on the platform you are running. WordPress, plain PHP apps, Django, and Node.js all fail in different ways, and the fastest path to a fix is usually the one that matches the stack underneath the error.
WordPress
If you’re working with WordPress, start by turning on WordPress’s own debugging tools. In wp-config.php, enable WP_DEBUG and WP_DEBUG_LOG, so WordPress writes the real error to a log file instead of only showing a blank page or a generic 500. WordPress recommends these constants for debugging and notes that WP_DEBUG_LOG writes to wp-content/debug.log by default.
If the error started after a plugin, theme, or PHP version update, test compatibility next. WordPress’s own troubleshooting guidance recommends deactivating all plugins, then reactivating them one by one until the failure returns. If you’re locked out of the admin area, you can do so via FTP or your host’s file manager by temporarily renaming the plugins directory.
If memory is the issue, raise WP_MEMORY_LIMIT:
If the core files may be corrupted, reinstall WordPress without touching wp-content. That refreshes wp-admin and wp-includes while leaving your themes, plugins, and uploads in place.
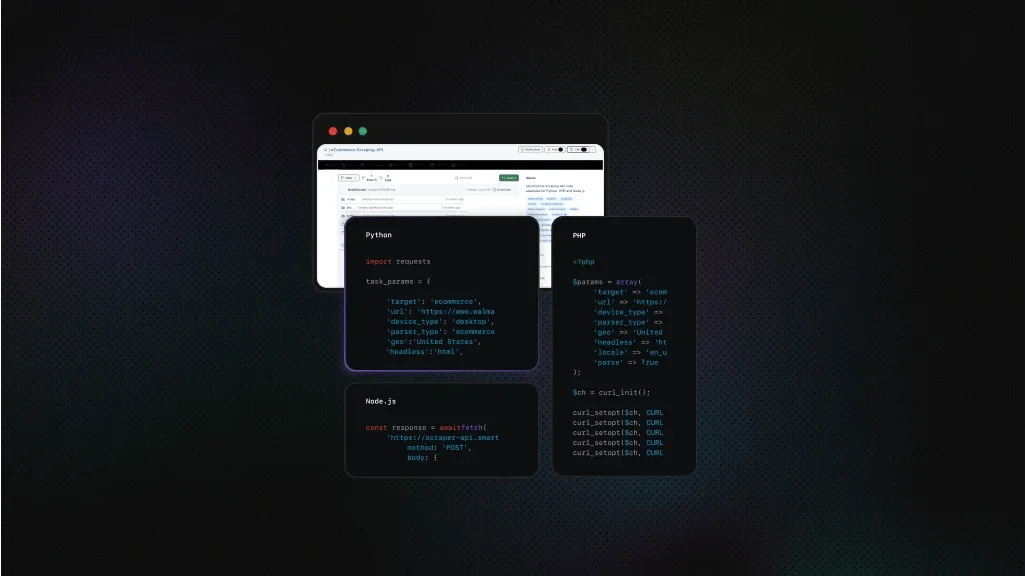
PHP applications
For plain PHP applications, the main goal is to surface the actual runtime error instead of the generic 500.
A common starting point during debugging is:
PHP’s official docs confirm that ini_set() can change configuration values at runtime when they are allowed to be changed, and error_reporting(E_ALL) enables reporting for all PHP errors.
Then check the PHP settings that commonly trigger server-side failures:
- memory_limit
- max_execution_time
- upload_max_filesize
Those directives live in php.ini, and PHP documents all 3 as core configuration settings that directly affect execution and request handling.
Also, review .htaccess if the app runs on Apache. Some PHP directives in .htaccess only work in certain SAPIs, and mismatched or unsupported directives can cause an internal server error instead of being ignored cleanly. Finally, confirm that the PHP version on the server actually matches what the application requires. A version mismatch is one of the fastest ways to turn an otherwise working app into a 500 generator.
Django and Python
For Django, the first job is to expose the traceback in a safe environment. Set DEBUG = True temporarily in development so Django shows the real exception instead of a generic error page. Django’s settings docs are very clear that DEBUG should not stay enabled in production.
Then check ALLOWED_HOSTS. If it's wrong or incomplete, requests can fail before your app even reaches the view logic. Django documents ALLOWED_HOSTS as a security setting that must include the hostnames your app should serve.
After that, verify the database configuration in settings.py and run Django’s built-in checks:
Django documents check as a command for validating configuration and catching common project issues.
If the failure involves missing CSS, JS, or static assets in production, collect static files again:
That command gathers static assets into the configured destination, which is a common deployment step and a common source of breakage when skipped or misconfigured.
Node.js and Express
In Express apps, 500 errors often stem from exceptions that were never properly handled. The framework’s official docs recommend explicit error-handling middleware, and in Express 5, they note that route handlers returning rejected Promises will automatically call next(err). A simple error handler still makes a big difference because it gives you one place to log and shape the response.
A basic example looks like this:
If the process is crashing rather than returning a normal 500 response, check the PM2 logs, systemd logs, or the process manager supervising the app. Environment variables are another common source of silent breakage in Node deployments, so confirm that all required values are present and correct before chasing deeper issues.
If the process is running out of memory, Node supports increasing the old-generation heap with the CLI flag below. Node’s CLI docs document --max-old-space-size in MiB.
The pattern across all 4 platforms is the same: stop treating the 500 as the real error. The 500 is only the surface. The useful signal is usually the framework-specific log, traceback, or runtime setting sitting underneath it.
Handling 500 errors when accessing external sites
If you’re not fixing your own site, a 500 can be harder to interpret. The same error might indicate the target site is genuinely broken, but it can also mean your requests are being rate-limited, flagged, or routed to a code path the site doesn't handle well.
Why do external sites return 500 errors to your requests
A real server-side failure is still one possibility. The target may actually be down, overloaded, or misconfigured.
But when you’re making repeated or automated requests, there are other common patterns too:
- The site is rate-limiting you, but the response shows up as a 500 instead of a cleaner throttle message
- An anti-bot system is intentionally returning noisy or misleading server errors to suspicious traffic
- Your request headers, session state, or request timing are triggering an edge case in their application
- An upstream dependency on their side is failing only for certain request paths or regions
That's why it helps to confirm whether the site is failing for everyone before assuming your code is broken.
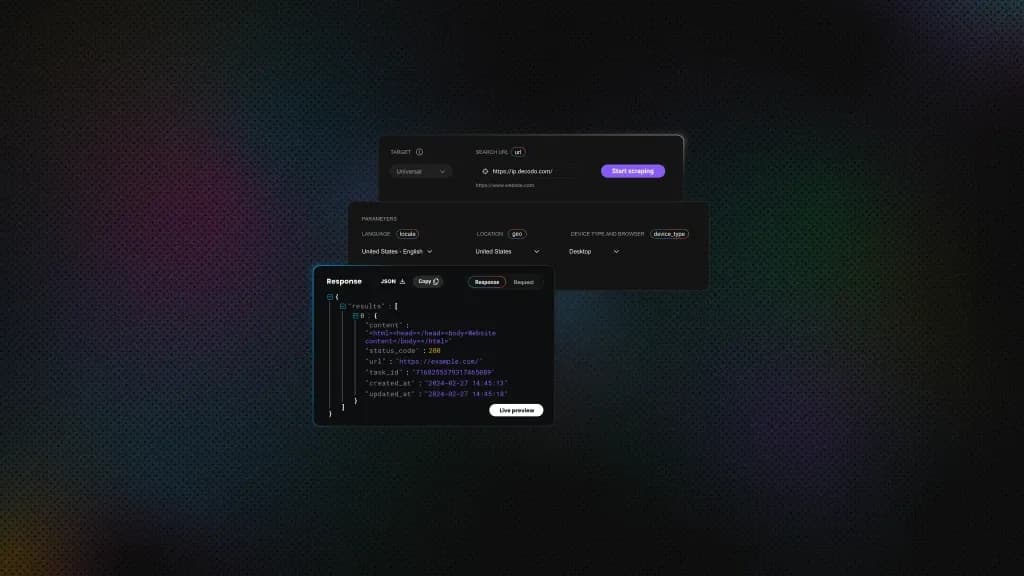
How to handle 500s when scraping or calling external APIs
When a target starts returning intermittent 500s, the safest response is not to hammer it harder. It's to slow down, retry carefully, and collect enough context to tell whether the problem is temporary, request-specific, or tied to your traffic pattern.
A practical response usually includes:
- Exponential backoff instead of immediate retries
- Slower request frequency
- Realistic headers and user-agent rotation
- IP rotation when repeated requests from one address start failing
- Checking whether the site is down more broadly before changing your scraper logic
Why proxies help here
If repeated requests from a single IP are triggering throttling or suspicion, rotating proxies can reduce the risk that all your traffic is concentrated on a single address. If you want the background on that, it helps to read about rotating proxies.
Residential proxies are especially relevant because they make requests appear more like ordinary user traffic than datacenter IPs do. Decodo’s residential proxy product supports rotating and sticky sessions, location targeting, and a large residential IP pool, which is exactly the kind of setup that helps spread requests out more naturally across targets and regions.
Try rotating residential proxies
Start your 3-day free trial with 100MB and test drive residential proxies with #1 response time in the market.
Geographic distribution also matters. In some cases, requests to the same target behave differently depending on region, edge node, or local traffic conditions. Spreading requests across locations can reduce the risk that a single server path or region becomes a bottleneck.
Build your scraper so it fails gracefully
A scraper that stops completely on the first 500 is fragile. A more resilient setup usually does 4 things:
- Retries with configurable limits instead of retrying forever
- Logs each 500 so you can see when failures spike
- Saves partial results instead of discarding everything
- Stops sending traffic for a while when repeated failures suggest the target is unstable
That last point is where a circuit-breaker-style approach helps: if the same endpoint keeps failing, back off and pause rather than continuing to send requests to a target that's already struggling or actively blocking you.
When a managed access layer makes more sense
There comes a point where solving this yourself becomes inefficient. If the target is returning 500s due to JavaScript checks, IP reputation, CAPTCHA walls, or more aggressive anti-bot systems, a basic requests-plus-retries setup will keep hitting rate limits.
That's where tools like Decodo residential proxies or Site Unblocker start to make more sense. Site Unblocker is an advanced access solution alongside its proxy products, specifically for difficult targets where standard traffic patterns are insufficient.
A useful way to think about it is this: if a 500 from an external site is really a traffic-handling or access problem, then the fix is often less about changing your parser and more about how the request is delivered.
Tools for monitoring and preventing 500 errors
If you only find out about 500 errors after users report them, you’re already late. Monitoring helps you catch failures earlier, see where they are happening, and spot patterns before they turn into visible downtime.
Uptime monitoring tools
- UptimeRobot, Pingdom, and updown.io check your site at intervals
- They alert you when pages start returning non-200 responses
- They work best when alerts go to email, Slack, or another channel your team actually watches
Log aggregation and error tracking
- ELK Stack, Papertrail, and Loggly help centralize logs
- Sentry, Rollbar, and Bugsnag help trace 500s back to exact exceptions, routes, or deployments
- These tools are especially useful when failures are intermittent or traffic-dependent
Application performance monitoring
- New Relic, Datadog, and Dynatrace help connect 500s to the request path underneath them
- They make it easier to spot slow queries, failing dependencies, response-time spikes, and bad releases
- They’re useful when the 500 is only the visible symptom of a deeper performance issue
Server health monitoring
- CPU, memory, and disk dashboards often explain 500s that logs alone cannot
- Prometheus and Grafana are useful when you want custom infrastructure metrics and alerting
- Resource alerts matter because exhaustion often shows up as application failure before anyone notices the server is under pressure
Preventing 500 internal server errors
You can't prevent every 500, but you can make them much less likely.
In development, the biggest gains usually come from testing changes before production, using proper error handling, and catching risky changes in code review. Automated tests help here too, especially when they cover the routes or flows that break most often after deployments.
On the server side, prevention is mostly about matching your infrastructure to your traffic. If the hosting is too weak to handle the load, 500s are more likely during spikes. Keeping PHP, your CMS, plugins, themes, and dependencies up to date also matters, especially since version mismatches are a known source of failures. A CDN can help reduce pressure on the origin server, lowering the risk of resource-related errors.
In day-to-day maintenance, backups matter more than people think. If a change breaks the site, a clean rollback is often the fastest path back to stability. It also helps to remove unused plugins and themes instead of letting old code sit around, and to schedule risky maintenance during lower-traffic periods.
From a security perspective, patched systems are usually more stable systems. Keeping software current reduces the chance of crashes caused by exploits or known vulnerabilities. A web application firewall can also help filter out malicious traffic before it reaches the application, and DDoS monitoring matters because overwhelmed servers often fail with the same generic 500 error that users see from other causes.
A good prevention strategy doesn't eliminate failure. It reduces failures, makes them easier to detect, and speeds recovery.
Residential proxies from 195+ locations
Bypass CAPTCHAs, IP bans, and geo-restrictions with 115M+ ethically-sourced IP pool.
Final thoughts
A 500 error is frustrating because the message is generic, but the underlying cause usually is not. In most cases, the real problem lies in something concrete: broken code, a bad config change, exhausted resources, a failed dependency, or a server that can't keep up.
That's why the most useful way to approach a 500 is systematically. Start by confirming the error, checking logs, reviewing recent changes, and working from the simplest fixes toward deeper platform-specific ones. If you’re dealing with external sites, treat repeated 500s as a signal to look at rate limits, anti-bot measures, and delivery strategy, rather than just your parser or request code.
The message may be broad, but the fix usually becomes much clearer once you know which layer actually failed.
About the author

Justinas Tamasevicius
Director of Engineering
Justinas Tamaševičius is Director of Engineering with over two decades of expertise in software development. What started as a self-taught passion during his school years has evolved into a distinguished career spanning backend engineering, system architecture, and infrastructure development.
Connect with Justinas via LinkedIn.
All information on Decodo Blog is provided on an as is basis and for informational purposes only. We make no representation and disclaim all liability with respect to your use of any information contained on Decodo Blog or any third-party websites that may belinked therein.