Scraping Google Trends: Methods, Tools, and Best Practices
While using Google Trends, you can discover the search interest rates for specific keywords during specific time frames in specific regions and analyze the popularity of Search keywords over time. This makes it possible to see how popular a topic is over time and across regions, without exposing sensitive search data. In this guide, we'll explain the kinds of data available from Google Trends, compare scraping techniques, and demonstrate two methods of gathering Google Trends data.
Kipras Kalzanauskas
Last updated: Oct 27, 2025
10 min read
TL;DR
- Google Trends data serves practical use cases, including brand monitoring, content planning, keyword research, competitor tracking, and historical seasonal analysis.
- Three main scraping methods exist. PyTrends (an unofficial Python library), Playwright, or Selenium for direct browser-based scraping, and Decodo's Web Scraping API for a no-code approach.
- PyTrends is no longer actively maintained and breaks frequently as Google updates its internal endpoints, making it unreliable for production pipelines.
- Google released an official Google Trends API in July 2025, though it remains in limited alpha. Most users still rely on third-party methods for stable access.
- Set up a virtual environment, install dependencies, and use proxies when scraping at scale to avoid hitting Google's rate limits or triggering CAPTCHA challenges.
- For scalable or recurring collection, a managed Web Scraping API eliminates the need to maintain scrapers as Google changes its page structure or anti-bot defenses.
Why scrape Google Trends data?
While the Google Trends interface is great for exploring a few keywords interactively, it's not designed for large-scale research or automation.
If you want to track hundreds of products, compare regions, or collect daily metrics for analysis, manual downloads quickly become impractical. You can automate the process with scraping and get the same data in structured formats like JSON or CSV.
Here are the main reasons professionals scrape Google Trends data:
- Keyword research. Google Trends is a powerful tool for SEO specialists and content marketers. It helps identify which search terms are gaining traction, how interest shifts over time, and where audiences are most active. Armed with this data, professionals can improve their marketing strategies to gain more website traffic.
- Market research. Marketers use Google Trends to understand consumer interests, detect seasonal demand changes, and predict upcoming market shifts. Google Trends also helps track search patterns, giving insights into what customers want and when.
- Brand monitoring. Businesses can use Google Trends to track their brand's popularity, compare it with competitors, and respond quickly to changes in public interest or measure campaign effectiveness in near real time.
- Content generation and planning. Writers and publishers can scrape topic trends to identify what audiences care about most. For example, collecting trending searches from multiple regions can help you localize blog topics, YouTube ideas, or ad content to match rising interests.
- Exploring historical data. Businesses can also explore historical data by adjusting the time frame to view trends over a few years or even specific date ranges. This flexibility allows for a more granular analysis of search volume trends, which can be useful for identifying seasonal patterns.
Understanding Google Trends data
Google Trends is designed to help users understand:
- The popularity of certain topics
- Geographical interest in various terms
- Seasonality of interest
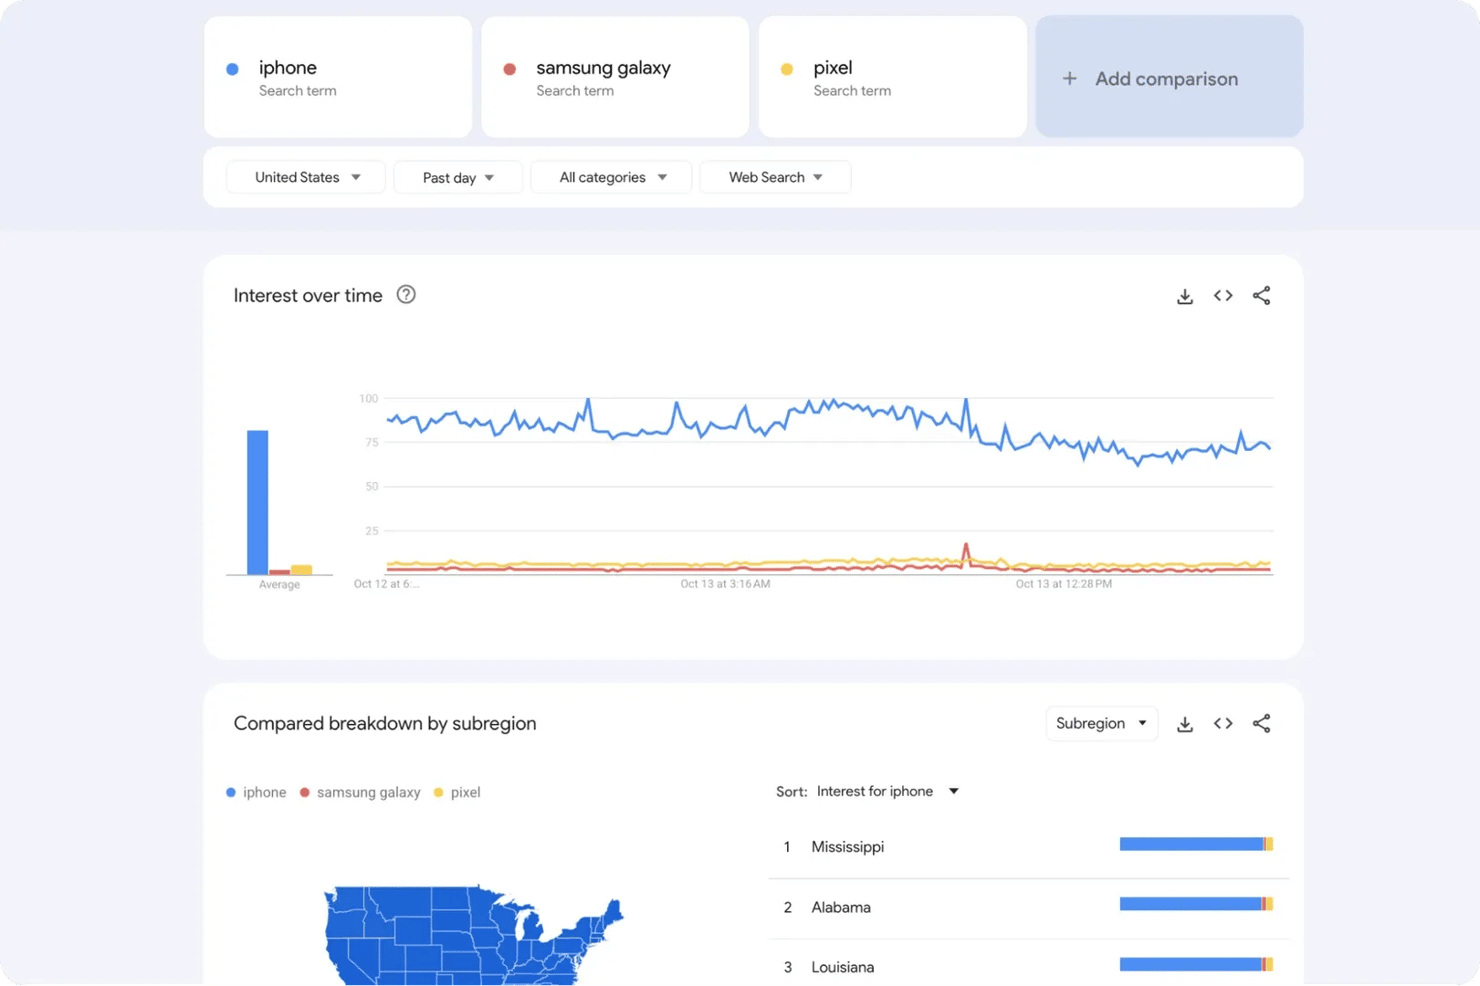
Imagine analyzing the keyword "iPhone" in the United States. The Google Trends chart will display a line graph showing how interest has fluctuated over time.
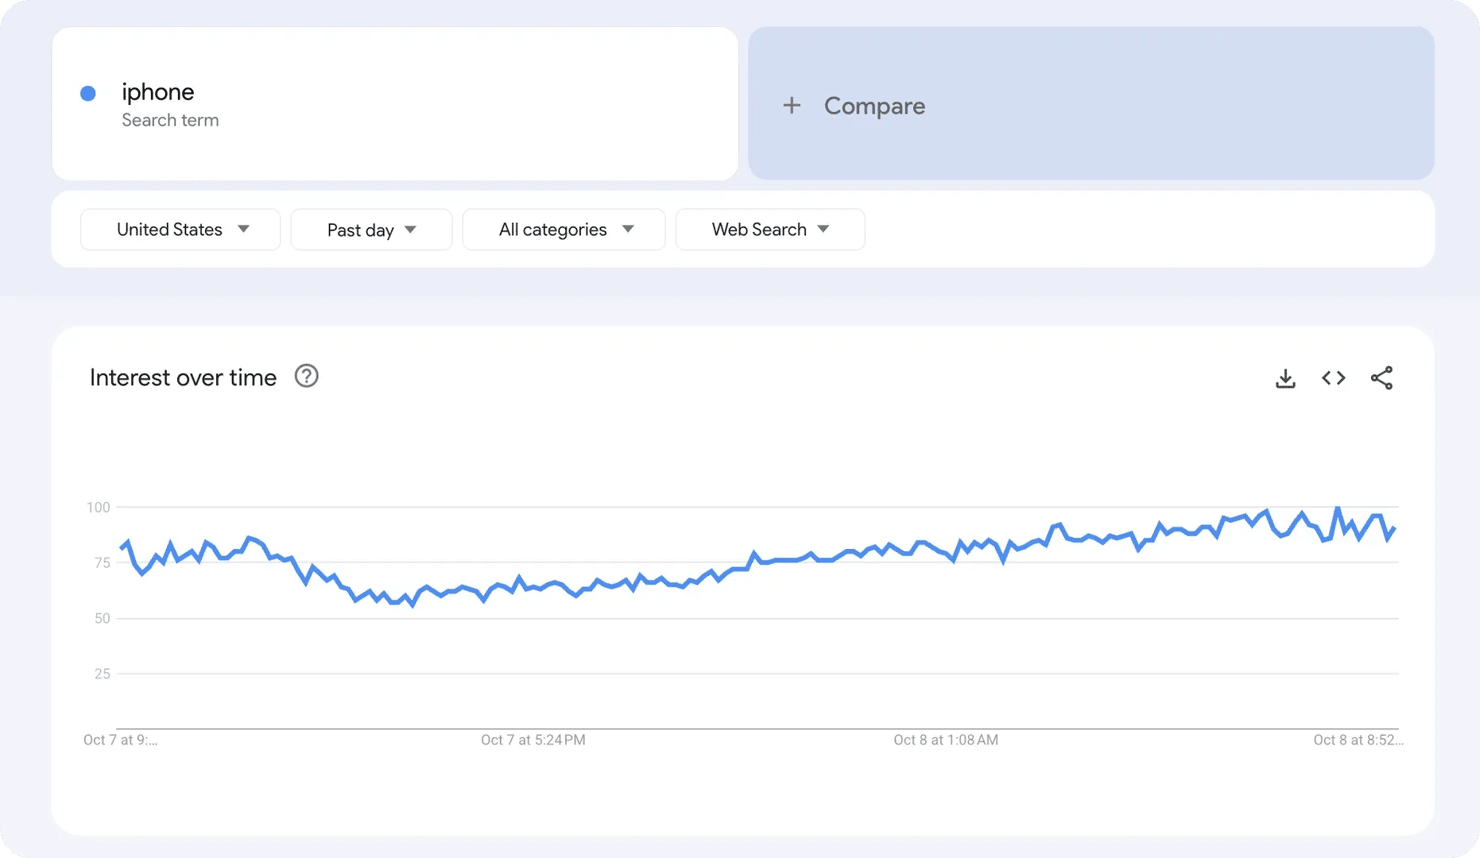
Here's what the numbers mean:
- 100 – Peak popularity for the selected parameters
- 50 – Half as popular as the peak
- 25 – Quarter as popular
- 0 – Below threshold OR insufficient data
You can even compare topics across different countries or platforms because the data points are normalized against total search volume and scaled on a 0–100 range.
Google Trends includes a "Compare" feature where you can input several keywords and compare their relative interest levels on the same chart. For example, comparing "iPhone", "Samsung Galaxy", and "Pixel" will instantly reveal which brand dominates user attention and how that shifts over time.
If you only need to analyze one or two keywords, you can easily export that data manually. However, if you want to monitor dozens of keywords across multiple regions or timeframes, manual downloads can quickly become unmanageable.
Overview of scraping methods
There are a few ways to scrape Google Trends data, each with its own trade-offs in difficulty, flexibility, and reliability. The best method for you depends on your technical experience and the scale of data you want to collect.
The three main approaches include:
- Using Google's official Trends API
- Building a DIY scraper
- Using a web scraper API
Google Trends API
After years of demand, Google finally launched its official Trends API in alpha on July 24, 2025. For the first time, developers can now access normalized, consistently scaled data directly from Google's backend without relying on third-party solutions.
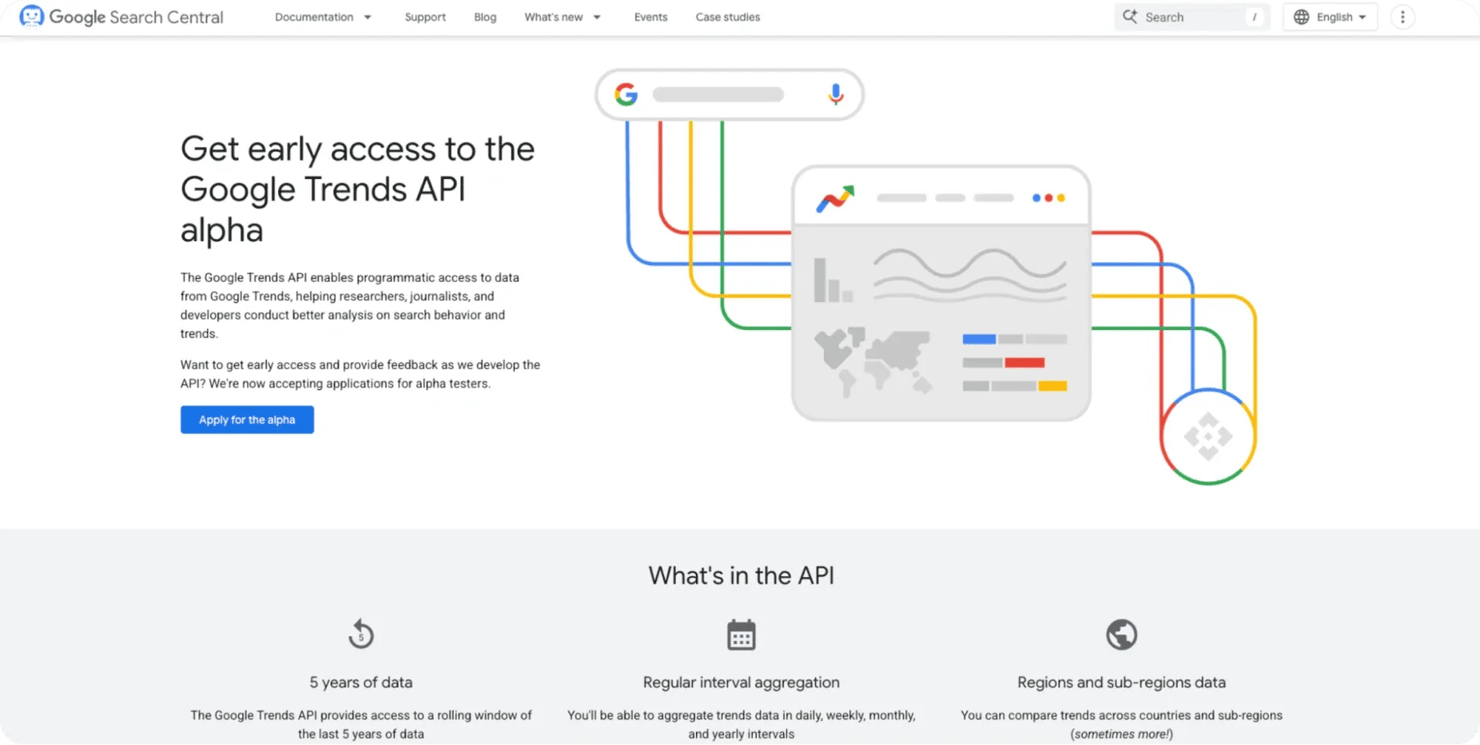
The API supports:
- Consistent 5-year trend data that can be merged across requests
- Clean JSON responses with stable scaling for all time ranges
- Native authentication and query structure
While this is an exciting milestone, it's still in a limited-access alpha stage.
Only a handful of testers can use it at the moment, and general availability hasn't been announced. If you want to try it, you can apply to join the alpha tester program on Google's developer site.
Benefits:
- Reliable, accurate data directly from Google
- No need to bypass anti-scraping systems
- Proper documentation and support
Challenges:
- Very limited access (invite-only at this stage)
- No public timeline for general availability
- May have usage quota or pricing when publicly released
- Limited to a 5-year historical window
Building a DIY scraping solution
You can also scrape Google Trends data by developing a scraper from scratch. This is the most challenging option, but it's also the cheapest and gives you the most control over your scraper, provided you're technically proficient enough to build and maintain it.
You can use any programming language to build a scraper, but Python is the most popular for web scraping. All you need is a workflow to download the Trends data, clean it, and store it.
Benefits:
- Full control over the scraping process and data pipeline
- Flexible customization for specific data needs or formats
- No dependency on third-party APIs or rate limits
Challenges:
- Google frequently updates its HTML structure, breaking selectors
- Risk of IP blocking without proper safeguards
- Requires ongoing maintenance and debugging
Prerequisites
Let's build a custom scraper. First, ensure that your development environment is properly set up.
1. Install Python. Download and install the latest stable version of Python from the official website. It's recommended to use Python 3.10 or newer for better library support. You can verify that Python is installed by running:
2. Choose an IDE. You can use Cursor, Visual Studio Code, or PyCharm to follow along. Any text editor or IDE that supports Python will work.
3. Create a virtual environment. A virtual environment allows you to isolate Python packages into separate directories to avoid version conflicts. To create a new virtual environment, execute the following command in your terminal:
This will generate a folder named "google_trends," which contains the isolated environment. Activate it using the appropriate command for your operating system:
On Windows, run:
On macOS and Linux, run:
4. Sign up for Decodo. To avoid frequent blocks from Google while scraping, you'll need a reliable proxy service. Decodo offers premium rotating residential and ISP proxies optimized for scraping Google properties like Google Trends.
To get started, simply sign up and activate a 3-day free trial to test out the service. Once you create an account, note down your credentials and proxy endpoint, as these will be required when configuring your scraper later in the guide.
Method 1: Scraping Google Trends with Playwright
Google Trends is a JavaScript-heavy site that blocks automated scraping through strict anti-bot systems. To access its data, we’ll use Playwright, a browser automation framework capable of executing JavaScript and mimicking real browsing behavior. Playwright can run headless or visible browser sessions, allowing us to load dynamic elements such as charts and export buttons.
1. Install dependencies
Start by installing Playwright and setting up the required browsers:
This will download Chromium, Firefox, and WebKit. We’ll use Chromium (Chrome) for best compatibility with Google services.
2. Handling Google's anti-bot mechanisms
Google Trends enforces rate limits and detects most automated browsers. To avoid detection, we use:
- Residential proxies. These make our requests appear as coming from real user IPs.
- Stealth settings. We disable Playwright's automation flags and spoof the user agent.
- Session cleanup. Each run clears cookies and local storage to start fresh.
Why you need proxies for Google Trends scraping
Google Trends enforces strict rate limits, and repeated access from the same IP will quickly trigger temporary bans or CAPTCHA challenges.
To stay under the radar, it's best to route your traffic through residential proxies. These proxies make your requests appear like those of real users coming from regular networks instead of datacenters.
Premium residential proxies rotate your IP address with each request, distributing your scraping activity across thousands of legitimate residential IPs.
This makes your requests appear as if they're coming from different real users around the world, rather than a single automated bot.
If you don't already have proxies set up, you can sign up on Decodo and activate a free 3-day trial to follow along. Now let's create a more sophisticated scraper that bypasses Google's detection:
Get residential proxies for Google Trends
Claim your 3-day free trial of residential proxies and explore full features with unrestricted access.
This combination helps bypass Google’s detection while maintaining stable connections through Decodo proxies.
3. Downloading Google Trends data
Once the page loads, Playwright locates and clicks the export buttons on the charts automatically. Each corresponds to a CSV file such as:
- Interest_Over_Time.csv
- Interest_By_SubRegion.csv
- Related_Topics.csv
- Related_Queries.csv
The script scrolls through the page to ensure all widgets are visible and waits for them to load before triggering downloads. Playwright’s expect_download() context ensures each file is saved correctly into a downloads folder.
If any file fails to download, the page is reloaded and the process repeats.
4. Retry logic and main execution
Google often returns temporary errors like HTTP 429 (Too Many Requests). The script includes retry loops that wait and reload the page if rate-limited or if chart widgets don’t appear.
Each attempt waits several seconds between retries, incrementally increasing the delay to appear more human-like. The script stops after several reloads or once all four CSV files are saved.
5. Understanding and cleaning the output
When successful, you’ll get up to four CSV files:
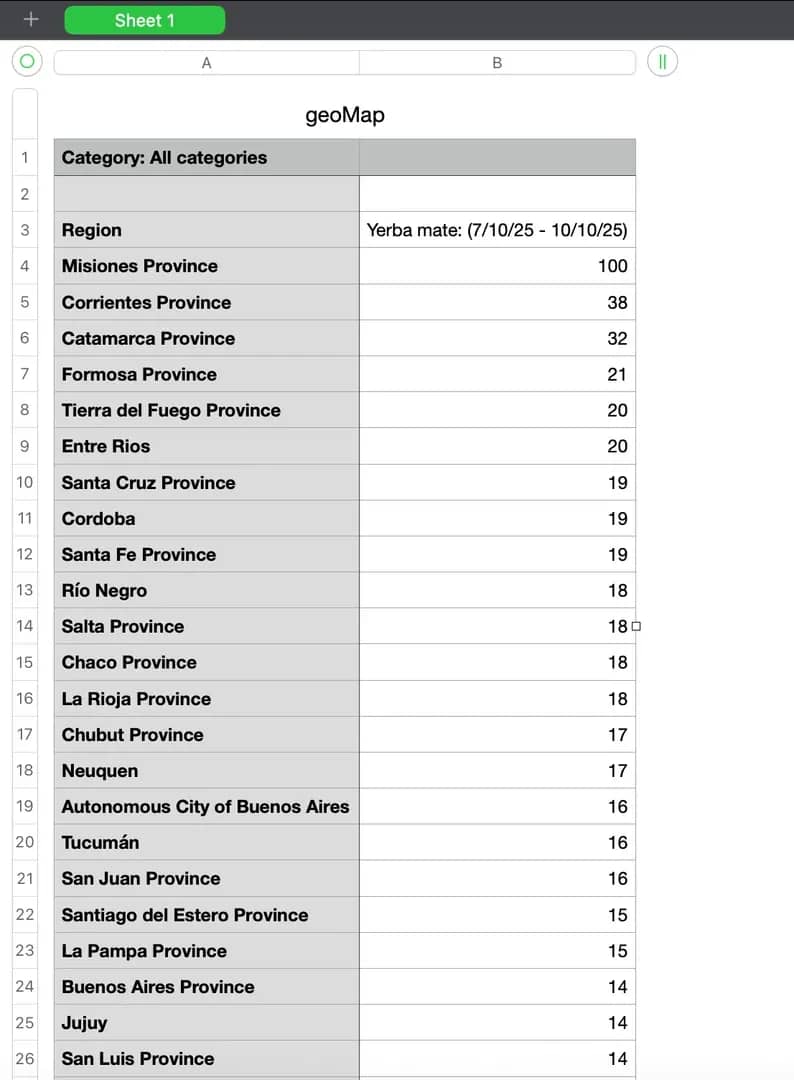
1. Interest by subregion data. This CSV shows geographic distribution of search interest across different regions (states, provinces, or cities depending on your query). Each row contains a location and its relative interest value (0-100).
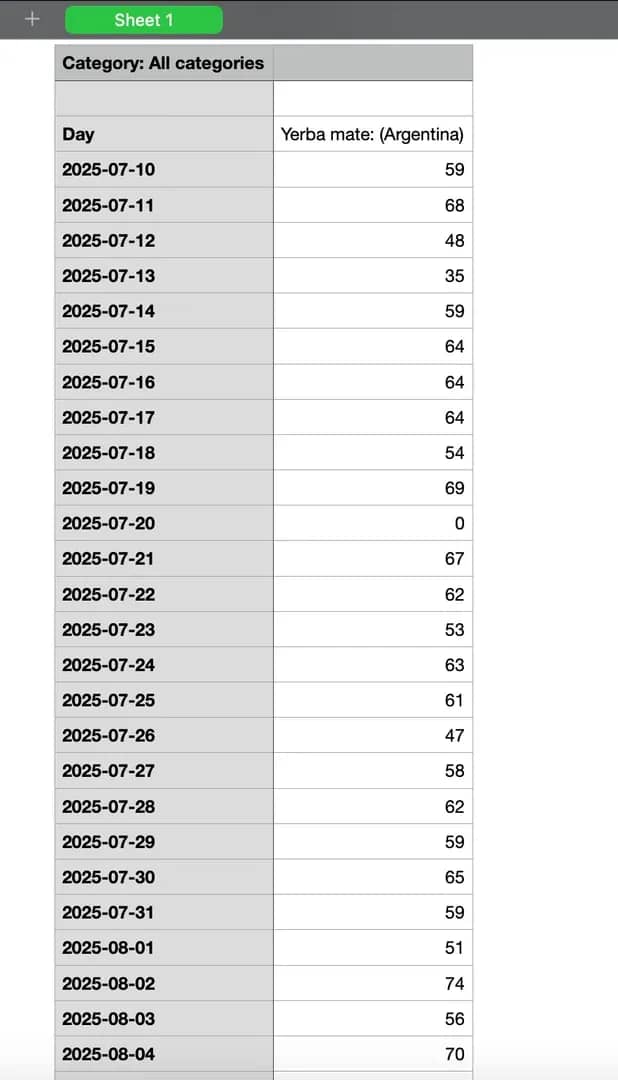
2. Interest over time data. This CSV contains time-series data showing how search interest changed during your specified date range. Each row represents a time point (hour, day, week, or month, depending on the range) with corresponding interest values.
3. Related topics. This CSV lists the topics that people searched for alongside your main query. Each entry shows a related subject and its relative popularity score, helping reveal broader themes or associations behind user interest. The data is divided into "Top" and "Rising" categories, showing consistently popular topics and those gaining momentum, respectively.
4. Related queries. This CSV captures specific search phrases users entered in connection with your keyword. It helps identify trending questions or alternative formulations of the same interest. Like related topics, it’s split into "Top" and "Rising" sections, reflecting both stable and emerging search patterns.
The script also performs automatic cleaning:
- Related data is split into "Top" and "Rising" categories.
- Time and region datasets are restructured and saved in a cleaned folder.
These cleaned CSVs are ready for analysis or integration into your data pipeline.
The complete custom scraper code
Here's the full Playwright script that brings together all the steps we've covered:
Note: Remember to replace YOUR_PROXY_USERNAME and YOUR_PROXY_PASSWORD with your actual proxy credentials from your Decodo dashboard.
Method 2: Scraping Google Trends using the backend API
Instead of automating the browser with Playwright, we can directly interact with Google Trends' internal API endpoints using Python. This method is faster, more lightweight, and doesn't require a browser or Chrome driver.
You'll need two key components:
- API URLs (captured from browser DevTools)
- HTTP client (e.g., httpx or Requests)
1. Inspect Google Trends network requests
Google Trends loads its data dynamically using background API calls. We can intercept these calls to identify the exact endpoints the website uses, then replicate those requests in our own code.
To start, open Google Trends in your browser and launch Developer Tools (press F12 or right-click → Inspect). Then navigate to the Network tab and filter by Fetch/XHR.
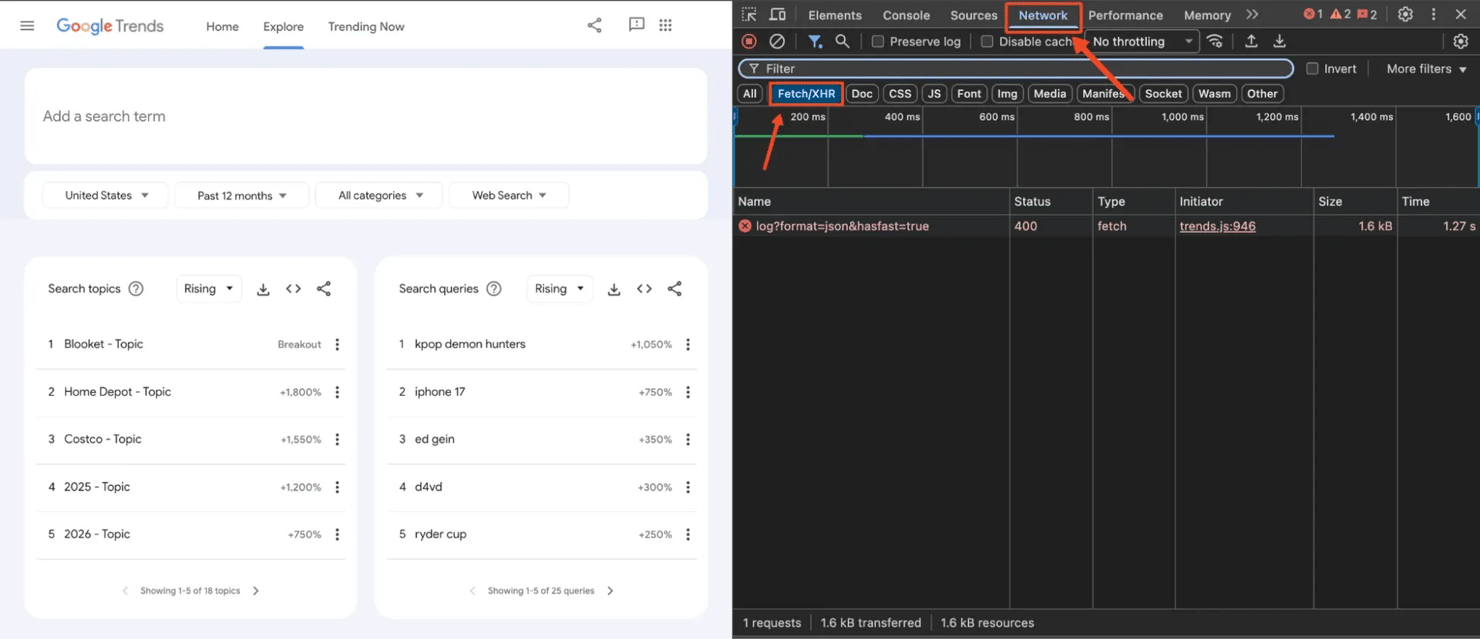
Look for requests labeled relatedsearches or filters for widgetdata. You'll see several API requests appear in the Network panel. These requests contain the actual JSON data that populates the charts and tables on the Google Trends interface.
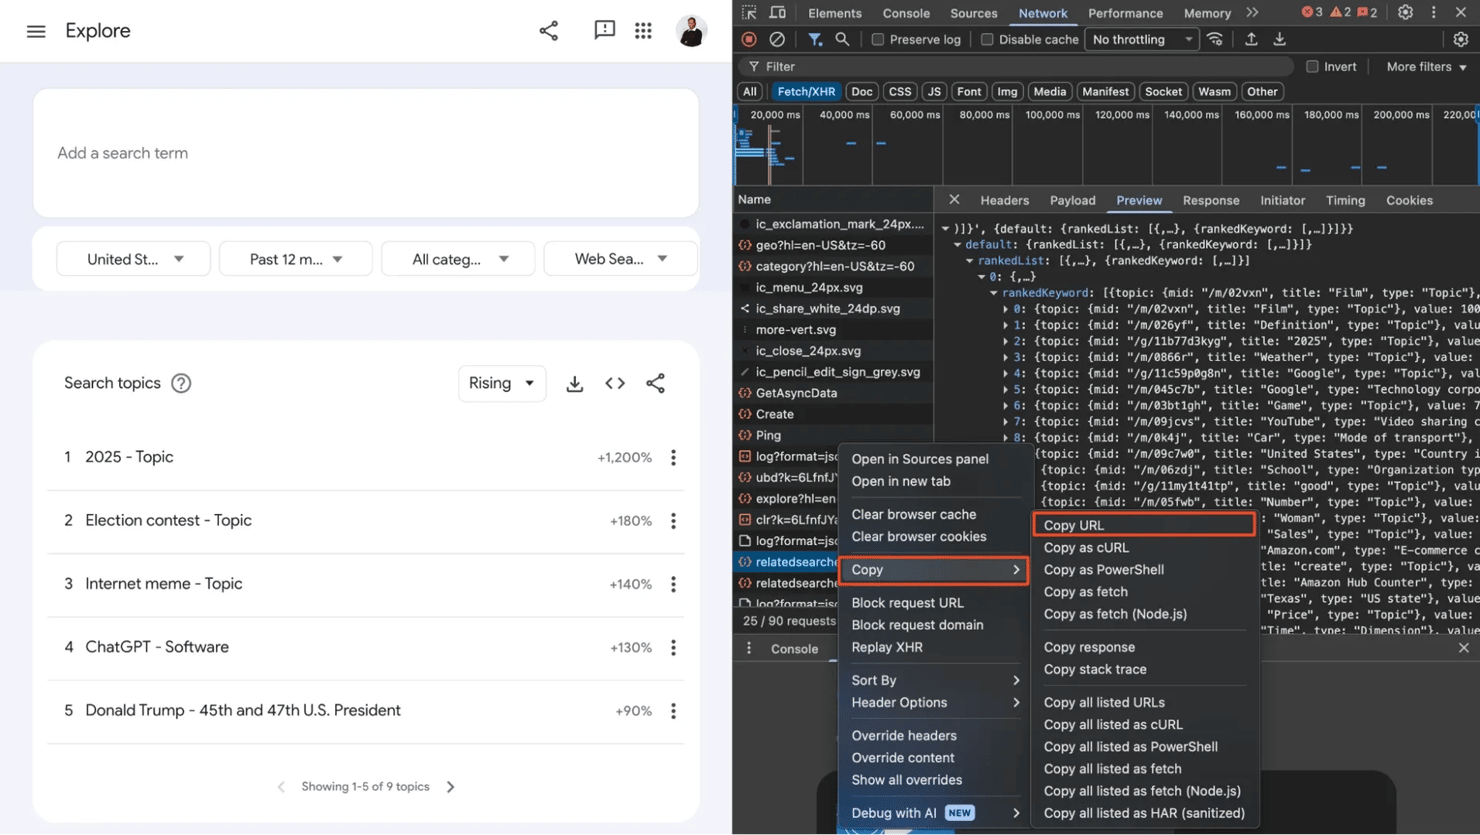
Once you identify the relevant requests, right-click on each request and select Copy → Copy link address. This gives you the exact endpoint you'll use to query Google's backend directly.
2. Send requests to the API
Once you've captured the URLs, you can use Python's Requests or httpx library to retrieve the JSON data. The copied URLs will look complex, with encoded parameters like this:
https://trends.google.com/trends/api/widgetdata/relatedsearches?hl=en-US&tz=-60&req=%7B%22restriction%22:%7B...%7D&token=APP6_UEAAAA...
Some key components of the URL are:
- hl – Language (e.g., en-US)
- tz – Timezone offset
- req – URL-encoded JSON containing search parameters (keyword, geo, time range, etc.)
- token – Authentication token (generated per request, expires quickly)
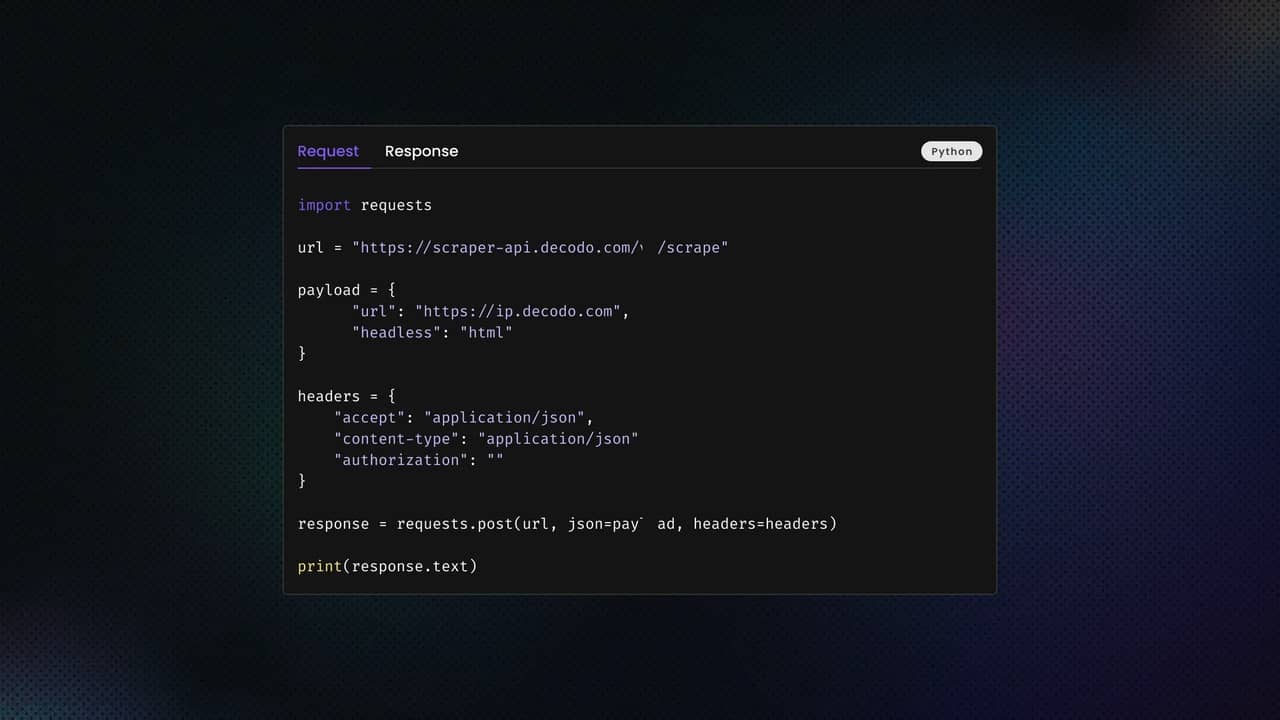
Let's set up a basic request:
At this point, we're making direct HTTP requests to Google's backend API without a browser. This is already faster than using Playwright or Selenium, as there's no page rendering, JavaScript execution, or DOM manipulation involved.
3. Parse and structure the JSON data
Google wraps the JSON responses with )]}', to prevent JSON hijacking attacks. We need to strip this before parsing:
Each endpoint returns ranked lists for related topics and queries. We can loop through these lists, extract the titles, search volumes, and links, and combine everything into a structured dataset:
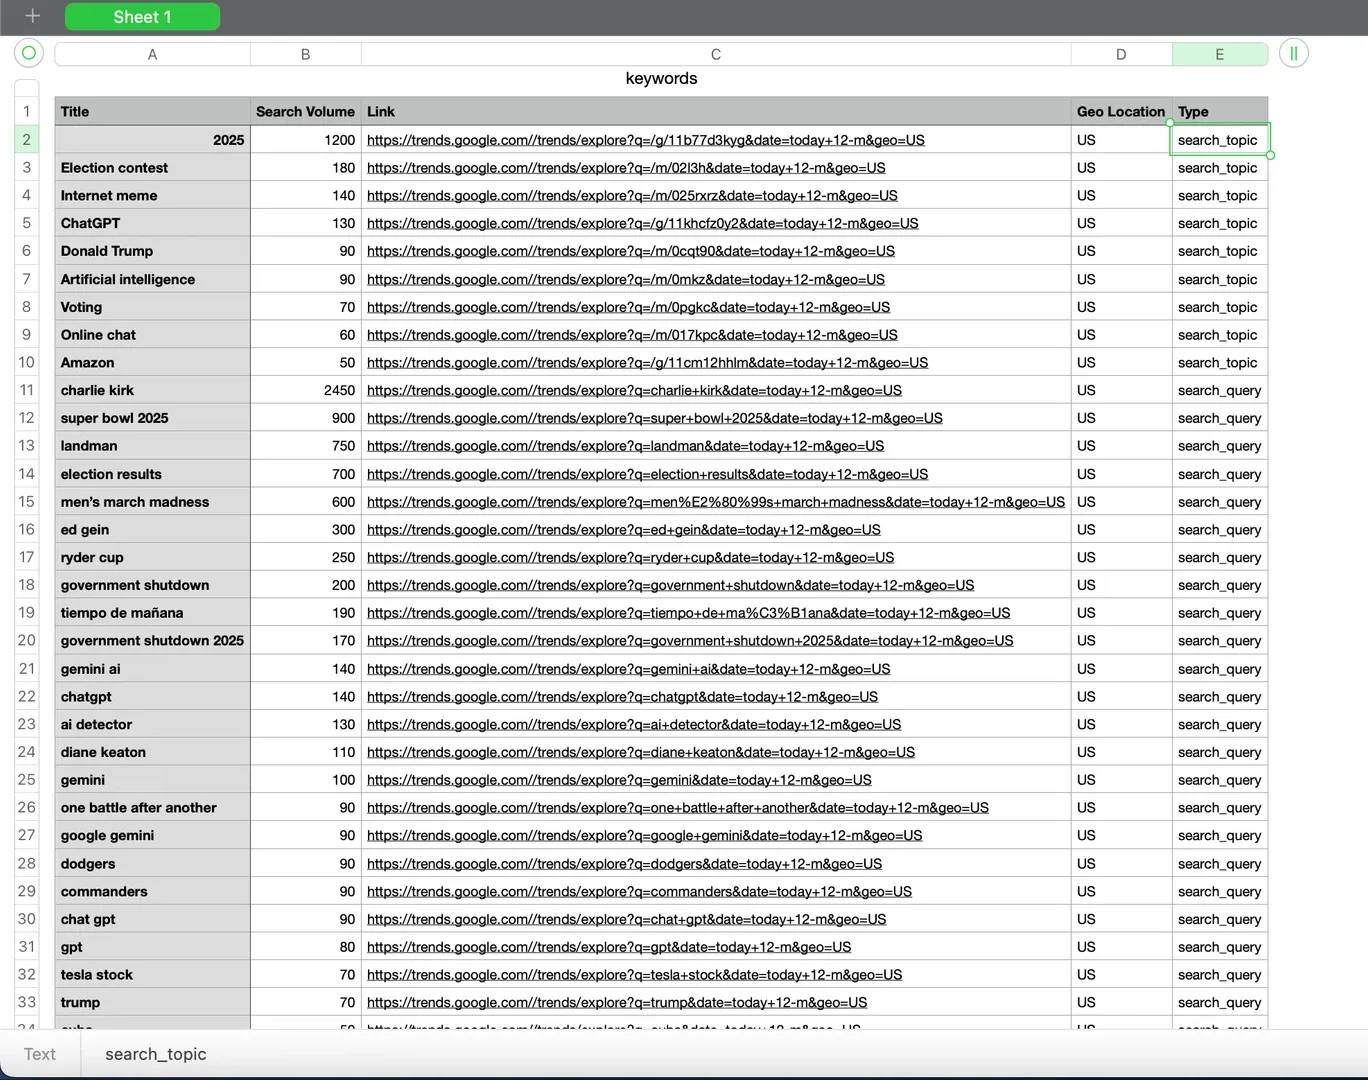
4. Saving to CSV
This will produce a google_trends_keywords.csv file containing our explore page data. Here's the result we got:
The complete API code
Here's the full script combining all the steps:
Note: The API URLs shown here are temporary and will expire after a short while. Each time you want to scrape new data, you need to open Google Trends, inspect the network requests in your browser's DevTools, and extract fresh URLs.
Common challenges and troubleshooting
Even with the right tools and setup, scraping Google Trends comes with its share of challenges. Here are the most common issues you'll encounter and how to resolve them.
1. Outdated or poorly maintained libraries
Tools like PyTrends, while once popular, are no longer actively maintained and often break due to frequent changes in Google's response structure. Many other developers report issues like:
- HTTP 400/429 errors
- Inconsistent JSON data
- Failed authentication or deprecated endpoints
Solution: Avoid relying solely on PyTrends. Instead, use a headless browser like Selenium or Playwright. Or use our Web Scraping API to abstract the complexity of maintaining scripts.
2. Frequent CAPTCHA or 429 errors
Google enforces rate limits and bot detection aggressively. After several consecutive requests from the same IP or without human-like behavior, you may either see the 429 error or CAPTCHA pages.
Solution: Rotate IPs using residential proxies and randomize delays between requests.
3. Changing HTML or JSON structure
Google Trends occasionally updates its frontend layout and backend JSON schema. This breaks CSS selectors, JSON keys, or download button identifiers in static scripts.
Solution: Regularly inspect the HTML structure and network requests in DevTools to confirm endpoints still work.
4. Download directory and permission issues
When automating CSV exports with Playwright, incorrect browser configurations can prevent downloads or cause permission errors.
Solution: double-check your Chrome options; ensure your scraper runs with write permissions in the working directory; verify that files are downloading to the expected folder before scaling the scraper.
5. Slow performance or timeouts
Rendering Google Trends pages with JavaScript-heavy content can be resource-intensive.
Solution: Use headless mode for faster loading and use Playwright over Selenium for resource-friendliness.
To sum up
Following this guide, you can efficiently download Google Trends data, manage proxy rotation, and bypass Google's bot protection mechanisms using either Playwright automation or direct backend API scraping.
For those seeking a simpler approach, using our ready-made Web Scraping API lets you scrape Google Trends quickly and easily without extensive coding.
It's ideal for users seeking a low-code or no-code solution that handles all the technical complexity for you. Curious to see how Decodo simplifies web scraping? Sign up now for a 3-day free trial.
Get high-quality residential IPs
Choose a residential proxy plan from Decodo and enjoy industry-leading performance and reliability.
About the author

Kipras Kalzanauskas
Senior Account Manager
Kipras is a strategic account expert with a strong background in sales, IT support, and data-driven solutions. Born and raised in Vilnius, he studied history at Vilnius University before spending time in the Lithuanian Military. For the past 3.5 years, he has been a key player at Decodo, working with Fortune 500 companies in eCommerce and Market Intelligence.
Connect with Kipras on LinkedIn.
All information on Decodo Blog is provided on an as is basis and for informational purposes only. We make no representation and disclaim all liability with respect to your use of any information contained on Decodo Blog or any third-party websites that may belinked therein.